13 Jan 2026
This is the story of figuring out why OpenRISC Linux was no longer booting on FPGA boards.
In July 2025 we received a bug report: #168 mor1kx pipeline is stuck in dualcore iverilog RTL simulation.
The report showed a hang on the second CPU of a custom
multicore platform. The
CPU cores that we use in FPGA based
SoCs are highly configurable,
we can change cache sizes, MMU set sizes, memory synchronization strategies and
other settings. Our first step were to ensure that these settings were
correct. After some initial discussions and adjustments the user was able to
make progress, but Linux booted and hung with an error. The following is a
snippet of the boot log:
[ 72.530000] Run /init as init process
[ 95.470000] rcu: INFO: rcu_sched detected stalls on CPUs/tasks:
[ 95.470000] rcu: (detected by 0, t=2102 jiffies, g=-1063, q=3 ncpus=2)
[ 95.470000] rcu: All QSes seen, last rcu_sched kthread activity 2088 (-20453--22541), jiffies_till_next_fqs=1, root ->qsmask 0x0
[ 95.470000] rcu: rcu_sched kthread timer wakeup didn't happen for 2087 jiffies! g-1063 f0x2 RCU_GP_WAIT_FQS(5) ->state=0x200
[ 95.470000] rcu: Possible timer handling issue on cpu=1 timer-softirq=194
[ 95.470000] rcu: rcu_sched kthread starved for 2088 jiffies! g-1063 f0x2 RCU_GP_WAIT_FQS(5) ->state=0x200 ->cpu=1
[ 95.470000] rcu: Unless rcu_sched kthread gets sufficient CPU time, OOM is now expected behavior.
[ 95.470000] rcu: RCU grace-period kthread stack dump:
[ 95.470000] task:rcu_sched state:R stack:0 pid:12 tgid:12 ppid:2 task_flags:0x208040 flags:0x00000000
[ 95.470000] Call trace:
[ 95.470000] [<(ptrval)>] 0xc00509a4
[ 95.470000] [<(ptrval)>] 0xc0050a04
In the above log we see an RCU
stall warning indicating that CPU 1 running but not making progressing and is
likely stuck in a tight loop. We can also see that the CPUs are both running
but hanging. It took until December 2025, 5 months, to locate and fix the bug.
In this article we will discuss how we debugged and solved this issue.
Reproducing the issue
The software that the user uses is the standard OpenRISC kernel and runtime. It has
been stable for some time running on the QEMU simulator that we use for the bulk
of our software development and testing.
To be honest I haven’t run the OpenRISC multicore platform on a physical FGPA
development board for a few years, so just setting up the environment was going
to be a significant undertaking.
For the past few years I have been concentrating on OpenRISC software
so this meant using QEMU which is much more convenient.
To get the environment running we need a bunch of stuff:
- De0 Nano Cyclone IV FPGA dev board with assortment of USB and serial device cables
- fusesoc 2.4.3 - Tool for RTL
package management, building and device programming.
- Quartus Prime Design Software 24.1 - for verilog synthesis and place and route
- The fusesoc OpenRISC multicore SoC - https://github.com/stffrdhrn/de0_nano-multicore
- OpenOCD 0.11.0 for debugging and loading software onto the board
- The OpenRISC toolchain 15.1.0
- Linux kernel source code
- Old kernel patches to get OpenRISC running on the de0 nano
- A busybox rootfs for userspace utilities
There is a lot of information about how to get your FPGA board working with
openrisc in our De0 Nano tutorials.
Please refer to the tutorials if you would like to follow up.
Some notes about what I had to figure out when getting the De0 Nano development environment up again:
- OpenOCD versions after 0.11 no longer work with OpenRISC and it’s
adv_debug_sys debug interface.
Never versions of OpenOCD will connect over the USB Blaster JTAG connection but
requests to write and read fail with CDC failures.
- While debugging the OpenOCD issues I verified our simulated
JTAG connectivity which uses OpenOCD to connect over
jtag_vpi does still work.
- Fusesoc is continuously evolving and the de0_nano and
de0_nano-multicore.
projects needed to be updated to get them working again.
Once the development board was loaded and running a simple hello world program
as per the tutorial I could continue try to run Linux.
Building the Linux Kernel
To build and load the Linux kernel requires the kernel source, a kernel config and a
devicetree
(DTS) file for our De0 Nano multicore board. At the time of this writing we didn’t have one available
in the upstream kernel source tree, so we need to create one. This means we
need to patch and configure the Linux kernel for De0 Nano support.
Patching the Kernel
We can start with the existing OpenRISC multicore kernel config then make some
adjustments. To get started we can configure the kernel with simple_smp_defconfig
as follows.
make ARCH=openrisc CROSS_COMPILE=or1k-linux- simple_smp_defconfig
make
This gives us a good baseline.
We then need to create a device tree that works for the De0 Nano, it is also
almost the same as the simple SMP board but:
- The FPGA SoC runs at 50Mhz instead of 20Mhz
- The FPGA SoC has no ethernet
Starting with the existing simple_smp.dts I modified it creating
de0nano-smp.dts and placed it in
the arch/openrisc/boot/dts directory.
--- arch/openrisc/boot/dts/simple_smp.dts       2026-02-11 20:15:20.244628708 +0000
+++ arch/openrisc/boot/dts/de0nano-smp.dts      2026-02-12 17:24:15.959947375 +0000
@@ -25,12 +25,12 @@
                cpu@0 {
                        compatible = "opencores,or1200-rtlsvn481";
                        reg = <0>;
-                       clock-frequency = <20000000>;
+                       clock-frequency = <50000000>;
                };
                cpu@1 {
                        compatible = "opencores,or1200-rtlsvn481";
                        reg = <1>;
-                       clock-frequency = <20000000>;
+                       clock-frequency = <50000000>;
                };
        };

@@ -57,13 +57,6 @@
                compatible = "opencores,uart16550-rtlsvn105", "ns16550a";
                reg = <0x90000000 0x100>;
                interrupts = <2>;
-               clock-frequency = <20000000>;
-       };
-
-       enet0: ethoc@92000000 {
-               compatible = "opencores,ethoc";
-               reg = <0x92000000 0x800>;
-               interrupts = <4>;
-               big-endian;
+               clock-frequency = <50000000>;
        };
 };
Configuring the kernel
The default smp config does not have debugging configured. Run make ARCH=openrisc menuconfig
and enable the following.
 Kernel hacking  --->
   printk and dmesg options  --->
    [*] Show timing information on printks              CONFIG_PRINTK_TIME=y
   Compile-time checks and compiler options  --->
        Debug information (Disable debug information)   CONFIG_DEBUG_INFO_DWARF_TOOLCHAIN_DEFAULT=y
    [*] Provide GDB scripts for kernel debugging        CONFIG_GDB_SCRIPTS=y

 General setup  --->
   [*] Configure standard kernel features (expert users)  --->
     [*]   Load all symbols for debugging/ksymoops      CONFIG_KALLSYMS=y
The CONFIG_KALLSYMS seems unremarkable, but it is one of the most important config switches
to enable. This enables our stack traces to show symbol information, which makes it easier to understand
where our crashes happen.
With all of that configured we can build the kernel.
make -j12 \
  ARCH=openrisc \
  CROSS_COMPILE=or1k-linux- \
  CONFIG_INITRAMFS_SOURCE="$HOME/work/openrisc/busybox-rootfs/initramfs $HOME/work/openrisc/busybox-rootfs/initramfs.devnodes" \
  CONFIG_BUILTIN_DTB_NAME="de0nano-smp"
When the kernel build is complete we should see our vmlinux image as follows.
$ ls -ltr | tail -n5
-rwxr-xr-x.   1 shorne shorne  104863360 Jan 30 13:30 vmlinux.unstripped
-rw-r--r--.   1 shorne shorne     971587 Jan 30 13:30 System.map
-rwxr-xr-x.   1 shorne shorne      11975 Jan 30 13:30 modules.builtin.modinfo
-rw-r--r--.   1 shorne shorne       1047 Jan 30 13:30 modules.builtin
-rwxr-xr-x.   1 shorne shorne  104763212 Jan 30 13:30 vmlinux
The vmlinux image is an ELF
binary ready to load onto our
board. I have also uploaded a patch for adding the device tree file and a defconfig
to GitHub for easy reproduction.
Booting the Image
Loading the kernel onto our FPGA board using the GDB and OpenOCD commands from the
tutorial the system boots.
The system runs for a while and maybe we can execute commands, 2 CPU’s are
reported online but after some time we get the following lockup and the system
stops.
[  410.790000] rcu: INFO: rcu_sched self-detected stall on CPU
[  410.790000] rcu:     0-...!: (2099 ticks this GP) idle=4f64/1/0x40000002 softirq=438/438 fqs=277
[  410.790000] rcu:     (t=2100 jiffies g=-387 q=1845 ncpus=2)
[  410.790000] rcu: rcu_sched kthread starved for 1544 jiffies! g-387 f0x0 RCU_GP_WAIT_FQS(5) ->state=0x0 ->cpu=1
[  410.790000] rcu:     Unless rcu_sched kthread gets sufficient CPU time, OOM is now expected behavior.
[  410.790000] rcu: RCU grace-period kthread stack dump:
[  410.790000] task:rcu_sched       state:R  running task     stack:0     pid:13    tgid:13    ppid:2      task_flags:0x208040 flags:0x00000000
...
[  411.000000] rcu: Stack dump where RCU GP kthread last ran:
[  411.000000] Task dump for CPU 1:
[  411.000000] task:kcompactd0      state:R  running task     stack:0     pid:29    tgid:29    ppid:2      task_flags:0x218040 flags:0x00000008
[  411.000000] Call trace:
[  411.050000] [<(ptrval)>] sched_show_task.part.0+0x104/0x138
[  411.050000] [<(ptrval)>] dump_cpu_task+0xd8/0xe0
[  411.050000] [<(ptrval)>] rcu_check_gp_kthread_starvation+0x1bc/0x1e4
[  411.050000] [<(ptrval)>] rcu_sched_clock_irq+0xd00/0xe9c
[  411.050000] [<(ptrval)>] ? ipi_icache_page_inv+0x0/0x24
[  411.050000] [<(ptrval)>] update_process_times+0xa8/0x128
[  411.050000] [<(ptrval)>] tick_nohz_handler+0xd8/0x264
[  411.050000] [<(ptrval)>] ? tick_program_event+0x78/0x100
[  411.100000] [<(ptrval)>] tick_nohz_lowres_handler+0x54/0x80
[  411.100000] [<(ptrval)>] timer_interrupt+0x88/0xc8
[  411.100000] [<(ptrval)>] _timer_handler+0x84/0x8c
[  411.100000] [<(ptrval)>] ? smp_call_function_many_cond+0x4d4/0x5b0
[  411.100000] [<(ptrval)>] ? ipi_icache_page_inv+0x0/0x24
[  411.100000] [<(ptrval)>] ? smp_call_function_many_cond+0x1bc/0x5b0
[  411.100000] [<(ptrval)>] ? __alloc_frozen_pages_noprof+0x118/0xde8
[  411.150000] [<(ptrval)>] ? ipi_icache_page_inv+0x14/0x24
[  411.150000] [<(ptrval)>] ? smp_call_function_many_cond+0x4d4/0x5b0
[  411.150000] [<(ptrval)>] on_each_cpu_cond_mask+0x28/0x38
[  411.150000] [<(ptrval)>] smp_icache_page_inv+0x30/0x40
[  411.150000] [<(ptrval)>] update_cache+0x12c/0x160
[  411.150000] [<(ptrval)>] handle_mm_fault+0xc48/0x1cc0
[  411.150000] [<(ptrval)>] ? _raw_spin_unlock_irqrestore+0x28/0x38
[  411.150000] [<(ptrval)>] do_page_fault+0x1d0/0x4b4
[  411.200000] [<(ptrval)>] ? sys_setpgid+0xe4/0x1f8
[  411.200000] [<(ptrval)>] ? _data_page_fault_handler+0x104/0x10c
[  411.200000] CPU: 0 UID: 0 PID: 61 Comm: sh Not tainted 6.19.0-rc5-simple-smp-00005-g4c0503f58a74 #339 NONE
[  411.200000] CPU #: 0
[  411.200000]    PC: c00e9dc4    SR: 0000807f    SP: c1235da4
[  411.200000] GPR00: 00000000 GPR01: c1235da4 GPR02: c1235e00 GPR03: 00000006
[  411.200000] GPR04: c1fe3ae0 GPR05: c1fe3ae0 GPR06: 00000000 GPR07: 00000000
[  411.200000] GPR08: 00000002 GPR09: c00ea0dc GPR10: c1234000 GPR11: 00000006
[  411.200000] GPR12: ffffffff GPR13: 00000002 GPR14: 300ef234 GPR15: c09b7b20
[  411.200000] GPR16: c1fc1b30 GPR17: 00000001 GPR18: c1fe3ae0 GPR19: c1fcffe0
[  411.200000] GPR20: 00000001 GPR21: ffffffff GPR22: 00000001 GPR23: 00000002
[  411.200000] GPR24: c0013950 GPR25: 00000000 GPR26: 00000001 GPR27: 00000000
[  411.200000] GPR28: 01616000 GPR29: 0000000b GPR30: 00000001 GPR31: 00000002
[  411.200000]   RES: 00000006 oGPR11: ffffffff
[  411.200000] Process sh (pid: 61, stackpage=c12457c0)
[  411.200000]
[  411.200000] Stack:
[  411.200000] Call trace:
[  411.200000] [<(ptrval)>] smp_call_function_many_cond+0x4d4/0x5b0
[  411.200000] [<(ptrval)>] on_each_cpu_cond_mask+0x28/0x38
[  411.200000] [<(ptrval)>] smp_icache_page_inv+0x30/0x40
[  411.200000] [<(ptrval)>] update_cache+0x12c/0x160
[  411.200000] [<(ptrval)>] handle_mm_fault+0xc48/0x1cc0
[  411.200000] [<(ptrval)>] ? _raw_spin_unlock_irqrestore+0x28/0x38
[  411.200000] [<(ptrval)>] do_page_fault+0x1d0/0x4b4
[  411.200000] [<(ptrval)>] ? sys_setpgid+0xe4/0x1f8
[  411.200000] [<(ptrval)>] ? _data_page_fault_handler+0x104/0x10c
[  411.200000]
[  411.200000]  c1235d84:       0000001c
[  411.200000]  c1235d88:       00000074
[  411.200000]  c1235d8c:       c1fc0008
[  411.200000]  c1235d90:       00000000
[  411.200000]  c1235d94:       c1235da4
[  411.200000]  c1235d98:       c0013964
[  411.200000]  c1235d9c:       c1235e00
[  411.200000]  c1235da0:       c00ea0dc
[  411.200000] (c1235da4:)      00000006
From the trace we can see both CPU’s are in similar code locations.
- CPU0 : is in
smp_icache_page_inv -> on_each_cpu_cond_mask -> smp_call_function_many_cond
- CPU1 : is in
smp_icache_page_inv -> on_each_cpu_cond_mask
CPU1 is additionally handling a timer which is reporting the RCU stall, we can
ignore those bits of the stack, as it is reporting the problem for us it is not
the root cause. So what is happening?
Let’s try to understand what is happening. The smp_icache_page_inv function
is called to invalidate an icache page, it will force all CPU’s to invalidate a
cache entry by scheduling each CPU to call a cache invalidation function. This
is scheduled with the smp_call_function_many_cond call.
On CPU0 and CPU1 this is being initiated by a page fault as we see
do_page_fault at the bottom of the stack. The do_page_fault function will be
called when the CPU handles a TLB miss exception or if there was a page fault.
This must mean that a executable page was not available in memory and access to
that page caused a fault, once the page was mapped the icache needs to be
invalidated, this is done via the kernel’s inter-processor interrupt
(IPI) mechanism.
The IPI allows one CPU to request work to be done on other CPUs, this is done
using the on_each_cpu_cond_mask function call.
If we open up the debugger we can see, we are stuck in csd_lock_wait here:
$ or1k-elf-gdb "$HOME/work/linux/vmlinux" -ex 'target remote :3333'
GNU gdb (GDB) 17.0.50.20250614-git
This GDB was configured as "--host=x86_64-pc-linux-gnu --target=or1k-elf".

#0  0xc00ea11c in csd_lock_wait (csd=0xc1fd0000) at kernel/smp.c:351
351             smp_cond_load_acquire(&csd->node.u_flags, !(VAL & CSD_FLAG_LOCK));
Checking the backtrace we see csd_lock_wait is indeed inside the IPI framework
function smp_call_function_many_cond:
(gdb) bt
#0  0xc00ea11c in csd_lock_wait (csd=0xc1fd0000) at kernel/smp.c:351
#1  smp_call_function_many_cond (mask=<optimized out>, func=0xc0013ca8 <ipi_icache_page_inv>, info=0xc1ff8920, scf_flags=<optimized out>,
    cond_func=<optimized out>) at kernel/smp.c:877
#2  0x0000002e in ?? ()
Here csd stands for Call Single Data which is part IPI framework’s remote
function call api. The csd_lock_wait function calls smp_cond_load_acquire
which we can see below:
kernel/smp.c
    static __always_inline void csd_lock_wait(call_single_data_t *csd)
    {
        smp_cond_load_acquire(&csd->node.u_flags, !(VAL & CSD_FLAG_LOCK));
    }
The CSD_FLAG_LOCK flag is defined as seen here:
include/linux/smp_types.h
enum {
        CSD_FLAG_LOCK           = 0x01,
        ...
The smp_cond_load_acquire macro is just a loop waiting for &csd->node.u_flags
the 1 bit CSD_FLAG_LOCK to be cleared.
If we check the value of the u_flags:
(gdb) p/x csd->node.u_flags
$14 = 0x86330004
What is this we see? The value is 0x86330004, but that means the 0x1 bit is not set.
It should be exiting the loop. As the RCU stall warning predicted our CPU is
stuck in tight loop. In this case the loop is in csd_lock_wait.
The value in memory does not match the value the CPU is reading. Is this a
memory synchronization issue? Does the CPU cache incorrectly have the locked
flag?
It’s a Hardware Issue
As this software works fine in QEMU, I was first suspecting this was a hardware
issue. Perhaps there is an issue with cache coherency.
Luckily on OpenRISC we can disable caches. I built the CPU with the caches
disabled, this is done by changing the following module parameters from
ENABLED to NONE as below, then re-synthesizing.
$ grep -r FEATURE.*CACHE ../de0_nano-multicore/
../de0_nano-multicore/rtl/verilog/orpsoc_top.v: .FEATURE_INSTRUCTIONCACHE       ("ENABLED"),
../de0_nano-multicore/rtl/verilog/orpsoc_top.v: .FEATURE_DATACACHE              ("ENABLED"),
../de0_nano-multicore/rtl/verilog/orpsoc_top.v: .FEATURE_INSTRUCTIONCACHE       ("ENABLED"),
../de0_nano-multicore/rtl/verilog/orpsoc_top.v: .FEATURE_DATACACHE              ("ENABLED"),
After this the system booted very slow, but we still had hang’s, I was stumped.
Gemini to the Rescue
I thought I would try out Gemini AI to help debug the issue. I was able to paste
in the kernel crash dumps and AI was able to come to the same conclusion
I did. It thought that it may be a memory synchonization issue.
But Gemini was not able to help, it kept chasing red herrings.
- At first it suggsted looking at the memory barriers in the
csd_lock_wait code.
I uploaded some of the OpenRISC kernel source code. It was certain it found the
issue, I was not convinced but humored it. It suggested kernel patches
I applied them and confirmed they didn’t help.
- I asked if it could be a hardware bug, Gemini thought this was a great idea.
If there was an issue with the CPU’s Load Store Unit (LSU) not flushing or
losing writes it could be the cause of the lock not being released. I uploaded
some of the OpenRISC CPU verilog source code. It was certain it found the bug
in the LSU, again I was not concinced looking at it’s patches.
The patches did not improve anything.
We went through several iterations of this, none of the suggestions were correct.
I humored the patches but they did not work.
Gemini does help with discussing the issues, highlighting details, and process
of elimination, but it’s not able think much beyond the evidence I provide.
They seem lack the ability to think beyond it’s current context.
We will need to figure this out on our own.
Using a Hardware Debugger
I had some doubt that the values I was seeing in the GDB debug session were
correct. As a last ditch effort I brought up SignalTap, an FPGA virtual logic
analyzer. In other words this is a hardware debugger.
What should we look for in SignalTap? We want to confirm what is really in memory
when the CPU is reading the flags variable from memory in the lock loop.
From our GDB session above we recall the csd_lock_wait lock loop was around PC address 0xc00ea11c.
If we dump this area of the Linux binary we see the following:
$ or1k-elf-objdump -d vmlinux | grep -C5 c00ea11c
c00ea108:       0c 00 00 07     l.bnf c00ea124 <smp_call_function_many_cond+0x1c4>
c00ea10c:       15 00 00 00     l.nop 0x0
c00ea110:       86 33 00 04     l.lwz r17,4(r19)  <---------------------------------+
c00ea114:       a6 31 00 01     l.andi r17,r17,0x1                                  |
c00ea118:       bc 11 00 00     l.sfeqi r17,0                                       |
c00ea11c:<--    0f ff ff fd     l.bnf c00ea110 <smp_call_function_many_cond+0x1b0> -+
c00ea120:       15 00 00 00      l.nop 0x0
c00ea124:       22 00 00 00     l.msync
c00ea128:       bc 17 00 02     l.sfeqi r23,2
c00ea12c:       0f ff ff e1     l.bnf c00ea0b0 <smp_call_function_many_cond+0x150>
c00ea130:       aa 20 00 01     l.ori r17,r0,0x1
We can see the l.lwz instruction is used to read in the flags value from
memory. The l.lwz instruction instructs the CPU to load data at an address in
memory to a CPU register. The CPU module that handles memory access is called
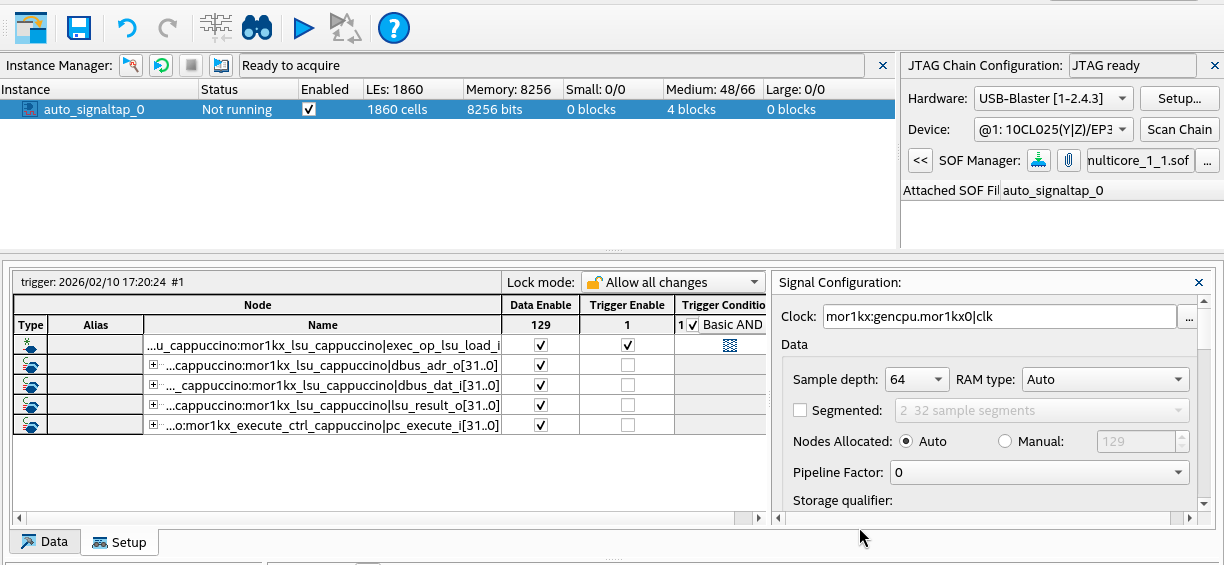
the Load Store Unit (LSU). Let’s setup the logic analyzer to capture the LSU
signals.
In CPU core 0’s module mor1kx_lsu_cappuccino select signals:
pc_execute_i - The PC for the execute stage, this lets us know which instruction is waiting to executeexec_op_lsu_load_i - Signal that is asserted when the LSU is being asked to perform a loaddbus_adr_o - The address being communicated from the LSU to the memory bus for the data loaddbus_dat_i - The data being communicated from the memory bus back to the LSUlsu_result_o - The data captured by the LSU to be written to the register file
Note 1 During this build, we disable the data cache to make sure loads are not
cached. Otherwise our load would go out to the memory bus one time and be hard
to capture in the logic analyzer.
Note 2 We select only signals on CPU 0, as the csd_lock_wait lock loop is occurring on both CPUs.
Note 3 I found that if I added too many signals to SignalTap that Linux would fail to boot
as the CPU would get stuck with BUS errors. So be aware.
In SignalTap our setup looks like the following:
After the setup we can try to boot the kernel and observe the lockup. When the lockup occurs
if we capture data we see the below:
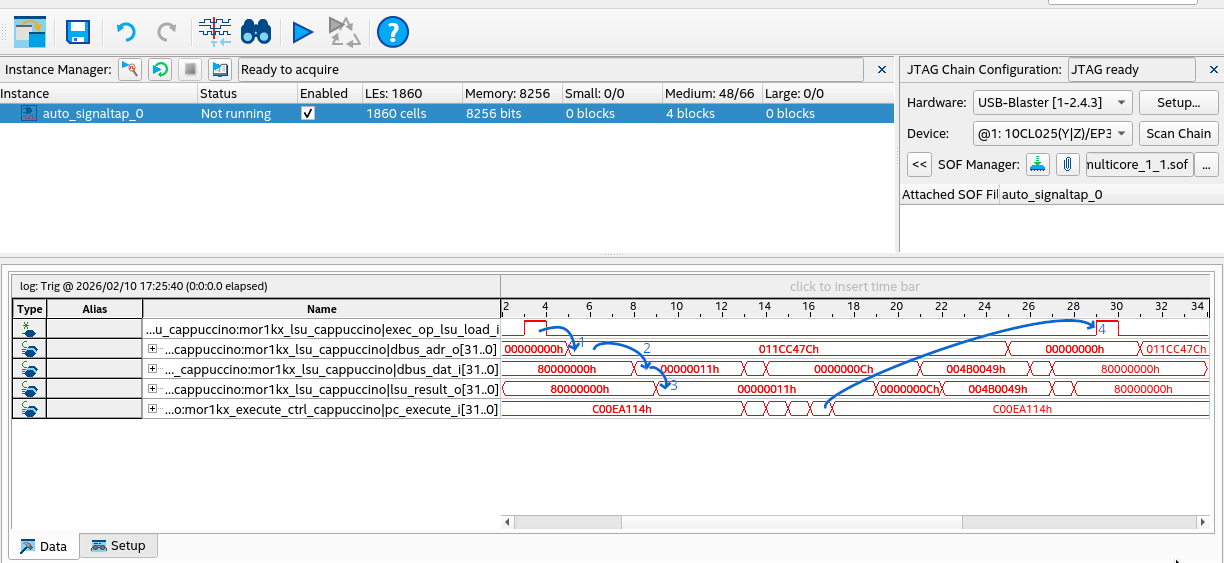
I have annotated the transitions in the trace:
- Moments after the
exec_op_lsu_load_i signal is asserted, the dbus_adr_o is set to
0x011cc47c. This is the memory address to be read.
- Next we see
0x11 on dbus_dat_i. This is the value read from memory.
- After this the value
0x11 is outputted on lsu_result_o confirming this is the value read.
- Finally after a few instructions the loop continues again and
exec_op_lsu_load_i is asserted.
Here we have confirmed the CPU is properly reading 0x11, the lock is still held. What does this mean
does it mean that CPU 1 (the secondary CPU) did not handle the IPI and release the lock?
It does mean that our GDB analysis is wrong. There is no memory synchonization issue
and the hardware is behaving as expect. We need another idea.
Actually, it’s a Kernel Issue
Since we know that is seems some IPIs are not getting handled properly
it would be good to be able to know how many IPIs are getting sent and lost.
I added a patch to capture and dump IPI stats
when OpenRISC crashes. What we see below is that CPU 1 is receiving no IPIs while
CPU 0 has received all IPIs sent by CPU 1.
[  648.180000] CPU: 0 UID: 0 PID: 1 Comm: init Tainted: G             L      6.19.0-rc4-de0nano-smp-00002-ga7fc4d
[  648.180000] Tainted: [L]=SOFTLOCKUP
[  648.180000] CPU #: 0
[  648.180000]    PC: c00ea100    SR: 0000807f    SP: c1031cf8
[  648.180000] GPR00: 00000000 GPR01: c1031cf8 GPR02: c1031d54 GPR03: 00000006
[  648.180000] GPR04: c1fe4ae0 GPR05: c1fe4ae0 GPR06: 00000000 GPR07: 00000000
[  648.180000] GPR08: 00000002 GPR09: c00ea420 GPR10: c1030000 GPR11: 00000006
[  648.180000] GPR12: 00000029 GPR13: 00000002 GPR14: c1fe4ae0 GPR15: 0000000b
[  648.180000] GPR16: c1fc1b60 GPR17: 00000011 GPR18: c1fe4ae0 GPR19: c1fd0010
[  648.180000] GPR20: 00000001 GPR21: ffffffff GPR22: 00000001 GPR23: 00000002
[  648.180000] GPR24: c0013c98 GPR25: 00000000 GPR26: 00000001 GPR27: c09cd7b0
[  648.180000] GPR28: 01608000 GPR29: c09c4524 GPR30: 00000006 GPR31: 00000000
[  648.180000]   RES: 00000006 oGPR11: ffffffff
...
[  648.180000] IPI stats:
[  648.180000] Wakeup IPIs                sent:        1 recv:        0
[  648.180000] Rescheduling IPIs          sent:        8 recv:        0
[  648.180000] Function call IPIs         sent:        0 recv:        0
[  648.180000] Function single call IPIs  sent:       41 recv:       46
...
[  660.260000] CPU: 1 UID: 0 PID: 29 Comm: kcompactd0 Tainted: G             L      6.19.0-rc4-de0nano-smp-00002-
[  660.260000] Tainted: [L]=SOFTLOCKUP
[  660.260000] CPU #: 1
[  660.260000]    PC: c053ca40    SR: 0000827f    SP: c1095b58
[  660.260000] GPR00: 00000000 GPR01: c1095b58 GPR02: c1095b60 GPR03: c11f003c
[  660.260000] GPR04: c11f20c0 GPR05: 3002e000 GPR06: c1095b64 GPR07: c1095b60
[  660.260000] GPR08: 00000000 GPR09: c0145c00 GPR10: c1094000 GPR11: c11fc05c
[  660.260000] GPR12: 00000000 GPR13: 0002003d GPR14: c1095d2c GPR15: 00000000
[  660.260000] GPR16: c1095b98 GPR17: 0000001d GPR18: c11f0000 GPR19: 0000001e
[  660.260000] GPR20: 30030000 GPR21: 001f001d GPR22: c1fe401c GPR23: c09cd7b0
[  660.260000] GPR24: ff000000 GPR25: 00000001 GPR26: 01000000 GPR27: c1ff21a4
[  660.260000] GPR28: 00000000 GPR29: c1095dd8 GPR30: 3002e000 GPR31: 00000002
[  660.260000]   RES: c11fc05c oGPR11: ffffffff
...
[  660.300000] IPI stats:
[  660.300000] Wakeup IPIs                sent:        0 recv:        0
[  660.310000] Rescheduling IPIs          sent:        0 recv:        0
[  660.310000] Function call IPIs         sent:        0 recv:        0
[  660.310000] Function single call IPIs  sent:       46 recv:        0
Why is this? With some extra debugging I found that the programmable interrupt
controller mask register (PICMR) was 0x0 on CPU 1. This means that all interrupts
on CPU 1 are masked and CPU 1 will never receive any interrupts.
After a quick patch to unmask IPIs
on secondary CPUs the system stability was fixed. This is the simple patch:
diff --git a/arch/openrisc/kernel/smp.c b/arch/openrisc/kernel/smp.c
index 86da4bc5ee0b..db3f6ff0b54a 100644
--- a/arch/openrisc/kernel/smp.c
+++ b/arch/openrisc/kernel/smp.c
@@ -138,6 +138,9 @@ asmlinkage __init void secondary_start_kernel(void)
        synchronise_count_slave(cpu);
        set_cpu_online(cpu, true);

+       // Enable IPIs, hack
+       mtspr(SPR_PICMR, mfspr(SPR_PICMR) | 0x2);
+
        local_irq_enable();
        /*
         * OK, it's off to the idle thread for us
Fixing the Bug Upstream
Simply unmasking the interrupts in Linux as I did above in the hack would not be accepted upstream.
There are irqchip APIs that handle interrupt unmasking.
The OpenRISC IPI patch
for the Linux 6.20/7.0 release updates the IPI interrupt driver to
register a percpu_irq which allows us to unmask the irq handler on each CPU.
In the patch series
I also added De0 Nano single core and multicore board
configurations to allow for easier board bring up.
What went wrong with GDB?
Why did GDB return the incorrect values when we were debugging initially?
GDB is not broken, but it could be improved when debugging kernel code.
Let’s look again at the GDB session and look at the addresses of our variables.
(gdb) l
346     {
347     }
348
349     static __always_inline void csd_lock_wait(call_single_data_t *csd)
350     {
351             smp_cond_load_acquire(&csd->node.u_flags, !(VAL & CSD_FLAG_LOCK));
352     }
353     #endif

(gdb) p/x csd->node.u_flags
$14 = 0x86330004

(gdb) p/x &csd->node.u_flags
$15 = 0xc1fd0004
Here we see the value GDB reads is 0x86330004, but the address of the variable is
0xc1fd0004. This is a kernel address as we see the 0xc0000000 address offset.
Let’s inspect the assembly code that is running.
(gdb) p/x $npc
$11 = 0xc00ea11c

(gdb) x/12i $npc-0xc000000c
   0xea110:     l.lwz r17,4(r19)
   0xea114:     l.andi r17,r17,0x1
   0xea118:     l.sfeqi r17,0
-->0xea11c:     l.bnf 0xea110
   0xea120:     l.nop 0x0
   0xea124:     l.msync
   0xea128:     l.sfeqi r23,2
   0xea12c:     l.bnf 0xea0b0
   0xea130:     l.ori r17,r0,0x1
   0xea134:     l.lwz r16,56(r1)
   0xea138:     l.lwz r18,60(r1)
   0xea13c:     l.lwz r20,64(r1)
Here we see the familiar loop, the register r19 stores the address of
csd->node and u_flags is at a 4 byte offset, hence l.lwz r17,4(r19).
The register r17 stores the value read from memory, then masked with 0x1.
We can see this below.
(gdb) p/x $r17
$4 = 0x1
(gdb) p/x $r19
$5 = 0xc1fd0000

(gdb) x/12x $r19
0xc1fd0000:     0x862a0008      0x862a0008      0x862a0008      0x862a0008
0xc1fd0010:     0x862a0008      0x862a0008      0x862a0008      0x862a0008
0xc1fd0020:     0x862a0008      0x862a0008      0x862a0008      0x862a0008
Here we see r19 is 0xc1fd0000 and if we inspect the memory at this location
we see values like 0x862a0008, which is strange.
Above we discussed these are kernel addresses, offset by 0xc0000000.
When the kernel does memory reads these will be mapped by the MMU to a physical address, in this case
0x01fd0004.
We can apply the offset ourselves and inspect memory as follows.
(gdb) x/12x $r19-0xc0000000
0x1fd0000:      0x00000000      0x00000011      0xc0013ca8      0xc1ff8920
0x1fd0010:      0x0000fe00      0x00000000      0x00000400      0x00000000
0x1fd0020:      0x01fd01fd      0x00000005      0x0000002e      0x0000002e
Bingo, this shows that we have 0x11 at 0x1fd0004 the lock value. Memory does
indeed contain 0x11 the same as the value read by the CPU.
When GDB does memory reads the debug interface issues reads directly to the
memory bus. The CPU and MMU are not involved. This means, at the moment, we
need to be careful when inspecting memory and be sure to perform the offsets
ourselves.
Conclusion
Debugging accross the hardware-software boundary requires a bit of experience
and a whole lot of parience. We initially thought that this was a harware
issue, but then eventually found a trivial issue in the OpenRISC multicore support
drivers. It took time and a few different tools to convince ourselves that the
hardware was fine. After refocusing on the kernel and building some tools
(the IPI stats report) we found the clue we needed.
This highlights the importance in embedded systems to know your tools and
architecturte. Or, in our case, remember that the MMU does not translate memory
reads over the JTAG interface. With the bug fixed and De0 Nano support merged upstream
Linux on the OpenRISC platform not now more accessible and stable than before.
Followups
Working on this issue highlighted that there are a few things to improve
in OpenRISC including:
- Tutorials and Upstreaming patches
- OpenOCD is currently broken for OpenRISC
- OpenOCD doesn’t support multicore (multicore patches never upstreamed)
- OpenOCD / GDB bugs
24 Aug 2023
In this series we introduce the OpenRISC
glibc FPU
port and the effort required to get user space FPU support into OpenRISC Linux.
Adding FPU support to user space
applications is a full stack project covering:
Have a look at previous articles if you need to catch up. In this article we will cover
updates done to the Linux kernel, GCC (done long ago) and GDB for debugging.
Porting Linux to an FPU
Supporting hardware floating point operations in Linux user space applications
means adding the ability for the Linux kernel to store and restore FPU state
upon context switches. This allows multiple programs to use the FPU at the same
time as if each program has it’s own floating point hardware. The kernel allows
programs to multiplex usage of the FPU transparently. This is similar to how
the kernel allows user programs to share other hardware like the CPU and
Memory.
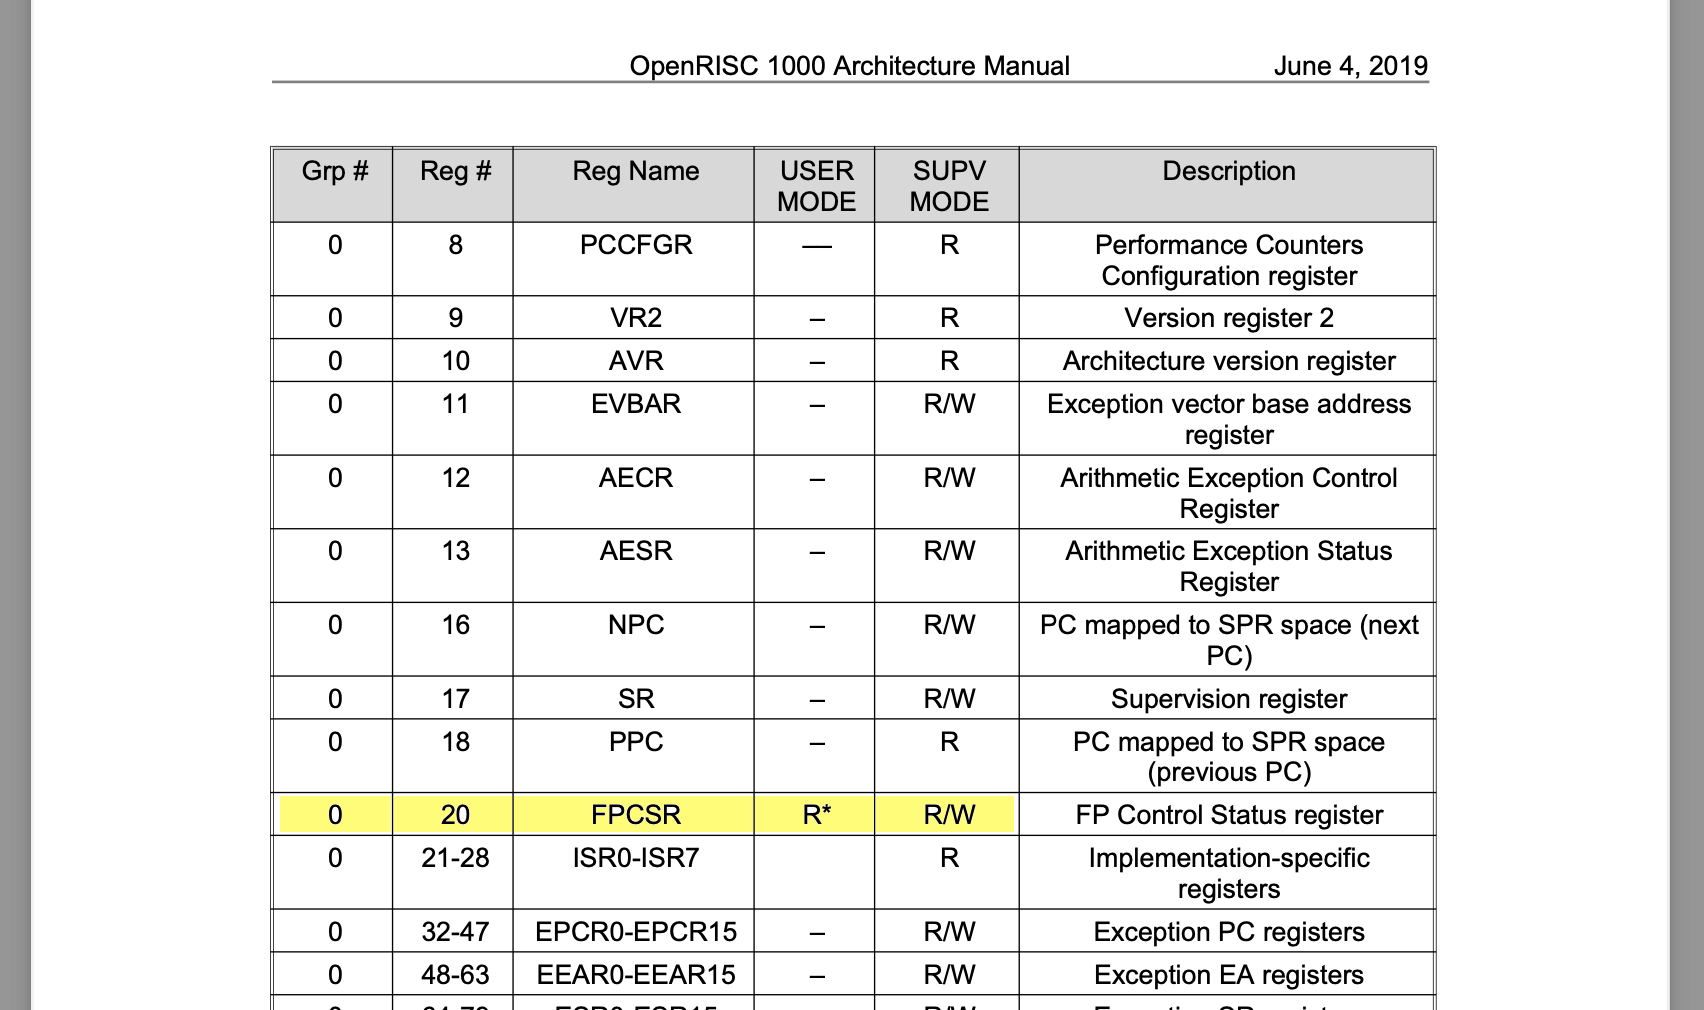
On OpenRISC this requires to only add one addition register, the floating point
control and status register (FPCSR) to to context switches. The FPCSR
contains status bits pertaining to rounding mode and exceptions.
We will cover three places where Linux needs to store FPU state:
- Context Switching
- Exception Context (Signal Frames)
- Register Sets
Context Switching
In order for the kernel to be able to support FPU usage in user space programs
it needs to be able to save and restore the FPU state during context switches.
Let’s look at the different kinds of context switches that happen in the Linux
Kernel to understand where FPU state needs to be stored and restored.
For our discussion purposes we will define a context switch as being
when one CPU state (context) is saved from CPU hardware (registers and program
counter) to memory and then another CPU state is loaded form memory to CPU
hardware. This can happen in a few ways.
- When handling exceptions such as interrupts
- When the scheduler wants to swap out one process for another.
Furthermore, exceptions may be categorized into one of two cases: Interrupts and
System calls. For each of these a different amount of CPU state needs to be saved.
- Interrupts - for timers, hardware interrupts, illegal instructions etc,
for this case the full context will be saved. As the switch is not
anticipated by the currently running program.
- System calls - for system calls the user space program knows that it is making a function
call and therefore will save required state as per OpenRISC calling conventions.
In this case the kernel needs to save only callee saved registers.
Below are outlines of the sequence of operations that take place when
transitioning from Interrupts and System calls into kernel code. It highlights
at what point state is saved with the INT,
kINT and FPU labels.
The monospace labels below correspond to the actual assembly labels in entry.S,
the part of the OpenRISC Linux kernel that handles entry into kernel code.
Interrupts (slow path)
EXCEPTION_ENTRY - all INT state is saved- Handle exception in kernel code
_resume_userspace - Check thread_info for work pending- If work pending
_work_pending - Call do_work_pending
- Check if reschedule needed
- If so, performs
_switch which save/restores kINT
and FPU state
- Check for pending signals
- If so, performs
do_signal which save/restores FPU state
RESTORE_ALL - all INT state is restored and return to user space
System calls (fast path)
_sys_call_handler - callee saved registers are saved- Handle syscall in kernel code
_syscall_check_work - Check thread_info for work pending- If work pending
- Save additional INT state
_work_pending - Call do_work_pending
- Check if reschedule needed
- If so, performs
_switch which save/restores kINT
and FPU state
- Check for pending signals
- If so, performs
do_signal which save/restores FPU state
RESTORE_ALL - all INT state is restored and return to user space
_syscall_resume_userspace - restore callee saved registers return to user space.
Some key points to note on the above:
- INT denotes the interrupts program’s register state.
- kINT denotes the kernel’s register state before/after a context switch.
- FPU deones FPU state
- In both cases step 4 checks for work pending, which may cause task
rescheduling in which case a Context Switch (or task switch) will
be performed.
If rescheduling is not performed then after the sequence is complete processing
will resume where it left off.
- Step 1, when switching from user mode to kernel mode is called a Mode Switch
- Interrupts may happen in user mode or kernel mode
- System calls will only happen in user mode
- FPU state only needs to be saved and restored for user mode programs,
because kernel mode programs, in general, do not use the FPU.
- The current version of the OpenRISC port as of
v6.8 save and restores both
INT and FPU state
what is shown before is a more optimized mechanism of only saving FPU state when needed. Further optimizations could
be still make to only save FPU state for user space, and not save/restore if it is already done.
With these principal’s in mind we can now look at how the mechanics of context
switching works.
Upon a Mode Switch from user mode to kernel mode the process thread
stack switches from using a user space stack to the associated kernel space
stack. The required state is stored to a stack frame in a pt_regs structure.
The pt_regs structure (originally ptrace registers) represents the CPU
registers and program counter context that needs to be saved.
Below we can see how the kernel stack and user space stack relate.
               kernel space

 +--------------+       +--------------+
 | Kernel Stack |       | Kernel stack |
 |     |        |       |    |         |
 |     v        |       |    |         |
 |   pt_regs' -------\  |    v         |
 |     v        |    |  |  pt_regs' --------\
 |   pt_reg''   |<+  |  |    v         |<+  |
 |              | |  |  |              | |  |
 +--------------+ |  |  +--------------+ |  |
 | thread_info  | |  |  | thread_info  | |  |
 | *task        | |  |  | *task        | |  |
 |  ksp ----------/  |  |  ksp-----------/  |
 +--------------+    |  +--------------+    |
                     |                      |
0xc0000000           |                      |
---------------------|----------------------|-----
                     |                      |
  process a          |   process b          |
 +--------------+    |  +------------+      |
 | User Stack   |    |  | User Stack |      |
 |     |        |    |  |    |       |      |
 |     V        |<---+  |    v       |<-----+
 |              |       |            |
 |              |       |            |
 | text         |       | text       |
 | heap         |       | heap       |
 +--------------+       +------------+


0x00000000
               user space
process a
In the above diagram notice how there are 2 set’s of pt_regs for process a.
The pt_regs’ structure represents the user space registers (INT)
that are saved during the switch from user mode to kernel mode. Notice how
the pt_regs’ structure has an arrow pointing the user space stack, that’s the
saved stack pointer. The second pt_regs’’ structure represents the frozen
kernel state (kINT)
that was saved before a task switch was performed.
process b
Also in the diagram above we can see process b has only a pt_regs’ (INT)
structure saved on the stack and does not currently have a pt_regs’’ (kINT)
structure saved. This indicates that that this process is currently running in
kernel space and is not yet frozen.
As we can see here, for OpenRISC there are two places to store state.
- The mode switch context is saved to a
pt_regs structure on the kernel
stack represented by pt_regs’ at this point only integer registers need to
be saved. This is represents the user process state.
- The context switch context is stored by OpenRISC again on the stack,
represented by pt_regs’‘. This represents the kernel’s state before a
task switch. All state that the kernel needs to resume later is stored. In
other architectures this state is not stored on the stack but to the
task
structure or to the thread_info structure. This context may store the all
extra registers including FPU and Vector registers.
Note In the above diagram we can see the kernel stack and
thread_info live in
the same memory space. This is a source of security issues and many
architectures have moved to support
virtually mapped kernel stacks,
OpenRISC does not yet support this and it would be a good opportunity
for improvement.
The structure of the pt_regs used by OpenRISC is as per below:
struct pt_regs {
	long gpr[32];
	long  pc;
	/* For restarting system calls:
	 * Set to syscall number for syscall exceptions,
	 * -1 for all other exceptions.
	 */
	long orig_gpr11;	/* For restarting system calls */
	long dummy;             /* Cheap alignment fix */
	long dummy2;		/* Cheap alignment fix */
};
The structure of thread_struct now used by OpenRISC to store the
user specific FPU state is as per below:
struct thread_struct {
       long fpcsr;      /* Floating point control status register. */
};
The patches to OpenRISC added to support saving and restoring FPU state
during context switches are below:
- 2023-04-26 63d7f9f11e5e Stafford Horne openrisc: Support storing and restoring fpu state
- 2024-03-14 ead6248f25e1 Stafford Horne openrisc: Move FPU state out of pt_regs
Signals and Signal Frames.
Signal frames are another place that we want FPU’s state, namely FPCSR, to be available.
When a user process receives a signal it executes a signal handler in the
process space on a stack slightly outside it’s current stack. This is setup
with setup_rt_frame.
As we saw above signals are received after syscalls or exceptions, during the
do_pending_work phase of the entry code. This means means FPU state will need
to be saved and restored.
Again, we can look at the stack frames to paint a picture of how this works.
               kernel space

 +--------------+
 | Kernel Stack |
 |     |        |
 |     v        |
 |   pt_regs' --------------------------\
 |              |<+                      |
 |              | |                      |
 |              | |                      |
 +--------------+ |                      |
 | thread_info  | |                      |
 | *task        | |                      |
 |  ksp ----------/                      |
 +--------------+                        |
                                         |
0xc0000000                               |
-------------------                      |
                                         |
  process a                              |
 +--------------+                        |
 | User Stack   |                        |
 |     |        |                        |
 |     V        |                        |
 |xxxxxxxxxxxxxx|> STACK_FRAME_OVERHEAD  |
 | siginfo      |\                       |
 | ucontext     | >- sigframe            |
 | retcode[]    |/                       |
 |              |<-----------------------/
 |              |
 | text         |
 | heap         |
 +--------------+

0x00000000
               user space
Here we can see that when we enter a signal handler, we can get a bunch of stuff
stuffed in the stack in a sigframe structure. This includes the ucontext,
or user context which points to the original state of the program, registers and
all. It also includes a bit of code, retcode, which is a trampoline to bring us
back into the kernel after the signal handler finishes.
Note we could also setup an alternate
signalstack
to use instead of stuffing stuff onto the main user stack. The
above example is the default behaviour.
The user pt_regs (as we called pt_regs’) is updated before returning to user
space to execute the signal handler code by updating the registers as follows:
  sp:    stack pinter updated to point to a new user stack area below sigframe
  pc:    program counter:  sa_handler(
  r3:    argument 1:                   signo,
  r4:    argument 2:                  &siginfo
  r5:    argument 3:                  &ucontext)
  r9:    link register:    retcode[]
Now, when we return from the kernel to user space, user space will resume in the
signal handler, which runs within the user process context.
After the signal handler completes it will execute the retcode
block which is setup to call the special system call rt_sigreturn.
Note for OpenRISC this means the stack has to be executable. Which is
a
major security vulnerability.
Modern architectures do not have executable stacks and use
vdso
or is provided by libc in
sa_restorer.
The rt_sigreturn system call will restore the ucontext registers (which
may have been updated by the signal handler) to the user pt_regs on the
kernel stack. This allows us to either restore the user context before the
signal was received or return to a new context setup by the signal handler.
A note on user space ABI compatibility for signals.
We need to to provide and restore the FPU FPCSR during signals via
ucontext but also not break user space ABI. The ABI is important because
kernel and user space programs may be built at different times. This means the
layout of existing fields in ucontext cannot change. As we can see below by
comparing the ucontext definitions from Linux, glibc and musl each program
maintains their own separate header file.
In Linux we cannot add fields to uc_sigcontext as it would make uc_sigmask
unable to be read. Fortunately we had a bit of space in sigcontext in the
unused oldmask field which we could repurpose for FPCSR.
The structure used by Linux to populate the signal frame is:
From: uapi/asm-generic/ucontext.h
struct ucontext {
        unsigned long     uc_flags;
        struct ucontext  *uc_link;
        stack_t           uc_stack;
        struct sigcontext uc_mcontext;
        sigset_t          uc_sigmask;
};
From: uapi/asm/ptrace.h
struct sigcontext {
        struct user_regs_struct regs;  /* needs to be first */
        union {
                unsigned long fpcsr;
                unsigned long oldmask;  /* unused */
        };
};
Note In
sigcontext originally a
union was not used
and
caused ABI breakage; which was soon fixed.
From: uapi/asm/sigcontext.h
struct user_regs_struct {
        unsigned long gpr[32];
        unsigned long pc;
        unsigned long sr;
};
The structure that glibc expects is.
/* Context to describe whole processor state.  */
typedef struct
  {
    unsigned long int __gprs[__NGREG];
    unsigned long int __pc;
    unsigned long int __sr;
  } mcontext_t;

/* Userlevel context.  */
typedef struct ucontext_t
  {
    unsigned long int __uc_flags;
    struct ucontext_t *uc_link;
    stack_t uc_stack;
    mcontext_t uc_mcontext;
    sigset_t uc_sigmask;
  } ucontext_t;
Note This is broken, the struct mcontext_t in glibc is
missing the space for oldmask.
The structure used by musl is:
typedef struct sigcontext {
	struct {
		unsigned long gpr[32];
		unsigned long pc;
		unsigned long sr;
	} regs;
	unsigned long oldmask;
} mcontext_t;

typedef struct __ucontext {
	unsigned long uc_flags;
	struct __ucontext *uc_link;
	stack_t uc_stack;
	mcontext_t uc_mcontext;
	sigset_t uc_sigmask;
} ucontext_t;
Below were the patches the to OpenRISC kernel to add floating point state to the
signal API. This originally caused some ABI breakage and was fixed in the second patch.
- 2023-04-26 27267655c531 Stafford Horne openrisc: Support floating point user api
- 2023-07-10 dceaafd66881 Stafford Horne openrisc: Union fpcsr and oldmask in sigcontext to unbreak userspace ABI
Register sets
Register sets provide debuggers the ability to read and save the state of
registers in other processes. This is done via the ptrace
PTRACE_GETREGSET and PTRACE_SETREGSET requests.
Regsets also define what is dumped to core dumps when a process crashes.
In OpenRISC we added the ability to get and set the FPCSR register
with the following patches:
- 2023-04-26 c91b4a07655d Stafford Horne openrisc: Add floating point regset (shorne/or1k-6.4-updates, or1k-6.4-updates)
- 2024-03-14 14f89b18c117 Stafford Horne openrisc: Move FPU state out of pt_regs
Porting GCC to an FPU
Supporting FPU Instructions
I ported GCC to the OpenRISC FPU back in 2019
, this entailed defining new instructions in the RTL machine description for
example:
 (define_insn "plussf3"
   [(set (match_operand:SF 0 "register_operand" "=r")
         (plus:SF (match_operand:SF 1 "register_operand" "r")
                  (match_operand:SF 2 "register_operand" "r")))]
   "TARGET_HARD_FLOAT"
   "lf.add.s\t%d0, %d1, %d2"
   [(set_attr "type" "fpu")])

 (define_insn "minussf3"
   [(set (match_operand:SF 0 "register_operand" "=r")
         (minus:SF (match_operand:SF 1 "register_operand" "r")
                   (match_operand:SF 2 "register_operand" "r")))]
   "TARGET_HARD_FLOAT"
   "lf.sub.s\t%d0, %d1, %d2"
   [(set_attr "type" "fpu")])
The above is a simplified example of GCC Register Transfer Language(RTL)
lisp expressions. Note, the real expression actually uses mode iterators and is a bit harder to understand, hence the simplified version above.
These expressions are used for translating the GCC compiler RTL from it’s abstract syntax tree
form to actual machine instructions.
Notice how the above expressions are in the format (define_insn INSN_NAME RTL_PATTERN CONDITION MACHINE_INSN ...). If
we break it down we see:
INSN_NAME - this is a unique name given to the instruction.RTL_PATTERN - this is a pattern we look for in the RTL tree, Notice how the lisp represents 3 registers connected by the instruction node.CONDITION - this is used to enable the instruction, in our case we use TARGET_HARD_FLOAT. This means if the GCC hardware floating point
option is enabled this expression will be enabled.MACHINE_INSN - this represents the actual OpenRISC assembly instruction that will be output.
Supporting Glibc Math
In order for glibc to properly support floating point operations GCC needs to do
a bit more than just support outputting floating point instructions. Another
component of GCC is software floating point emulation. When there are
operations not supported by hardware GCC needs to fallback to using software
emulation. With way GCC and GLIBC weave software math routines and floating
point instructions we can think of the FPU as a math accelerator. For example,
the floating point square root operation is not provided by OpenRISC hardware.
When operations like square root are not available by hardware glibc will inject
software routines to handle the operation. The outputted square root routine
may use hardware multiply lf.mul.s and divide lf.div.s operations to
accelerate the emulation.
In order for this to work correctly the rounding mode and exception state of the
FPU and libgcc emulation need to by in sync. Notably, we had one patch to fix an
issue with exceptions not being in sync which was found when running glibc
tests.
- 2023-03-19 33fb1625992 or1k: Do not clear existing FPU exceptions before updating
The libc math routines include:
- Trigonometry functions - For example
float sinf (float x)
- Logarithm functions - For example
float logf (float x)
- Hyperbolic functions - For example
float ccoshf (complex float z)
The above just names a few, but as you can imagine the floating point acceleration
provided by the FPU is essential for performant scientific applications.
Adding debugging capabilities for an FPU
FPU debugging allows a user to inspect the FPU specific registers.
This includes FPU state registers and flags as well as view the floating point
values in each general purpose register. This is not yet implemented on
OpenRISC.
This will be something others can take up. The work required is to map
Linux FPU register sets to GDB.
Summary
In summary adding floating point support to Linux revolved around adding one more register, the FPCSR,
to context switches and a few other places.
GCC fixes were needed to make sure hardware and software floating point routines could work together.
There are still improvements that can be done for the Linux port as noted above. In the next
article we will wrap things up by showing the glibc port.
Further Reading
22 Aug 2023
In the last article we introduced the
OpenRISC glibc FPU port and the effort required to get user space FPU support
into OpenRISC linux user applications. We explained how the FPU port is a
fullstack project covering:
- Architecture Specification
- Simulators and CPU implementations
- Linux Kernel support
- GCC Instructions and Soft FPU
- Binutils/GDB Debugging Support
- glibc support
In this entry we will cover updating Simulators and CPU implementations to support
the architecture changes which are called for as per the previous article.
- Allowing usermode programs to update the FPCSR register
- Detecting tininess before rounding
Simulator Updates
The simulators used for testing OpenRISC software without hardware are QEMU
and or1ksim. They both needed to be updated to cohere to the specification
updates discussed above.
Or1ksim Updates
The OpenRISC architectue simulator or1ksim has been updated with the single patch:
cpu: Allow FPCSR to be read/written in user mode.
The softfloat FPU implementation was already configured to detect tininess before
rounding.
If you are interested you can download and run the simulator and test this out
with a docker image pulled from docker hub using the following:
# using podman instead of docker, you can use docker here too
podman pull stffrdhrn/or1k-sim-env:latest
podman run -it --rm stffrdhrn/or1k-sim-env:latest

root@9a4a52eec8ee:/tmp# or1k-elf-sim -version
Seeding random generator with value 0x4a3c2bbd
OpenRISC 1000 Architectural Simulator, version 2023-08-20
This starts up an environment which has access to the OpenRISC architecture
simulator and a GNU compiler toolchain. While still in the container can run a
quick test using the FPU as follows:
# Create a test program using OpenRISC FPU
cat > fpee.c <<EOF
#include <float.h>
#include <stdio.h>
#include <or1k-sprs.h>
#include <or1k-support.h>

static void enter_user_mode() {
  int32_t sr = or1k_mfspr(OR1K_SPR_SYS_SR_ADDR);
  sr &= ~OR1K_SPR_SYS_SR_SM_MASK;
  or1k_mtspr(OR1K_SPR_SYS_SR_ADDR, sr);
}
static void enable_fpu_exceptions() {
  unsigned long fpcsr = OR1K_SPR_SYS_FPCSR_FPEE_MASK;
  or1k_mtspr(OR1K_SPR_SYS_FPCSR_ADDR, fpcsr);
}
static void fpe_handler() {
  printf("Got FPU Exception, PC: 0x%lx\n", or1k_mfspr(OR1K_SPR_SYS_EPCR_BASE));
}
int main() {
  float result;

  or1k_exception_handler_add(0xd, fpe_handler);
#ifdef USER_MODE
  /* Note, printf here also allocates some memory allowing user mode runtime to
     work.  */
  printf("Enabling user mode\n");
  enter_user_mode();
#endif
  enable_fpu_exceptions();

  printf("Exceptions enabled, now DIV 3.14 / 0!\n");
  result = 3.14f / 0.0f;

  /* Verify we see infinity.  */
  printf("Result: %f\n", result);
  /* Verify we see DZF set.  */
  printf("FPCSR: %x\n", or1k_mfspr(OR1K_SPR_SYS_FPCSR_ADDR));

#ifdef USER_MODE
  asm volatile("l.movhi r3, 0; l.nop 1"); /* Exit sim, now */
#endif
  return 0;
}
EOF

# Compile the program
or1k-elf-gcc -g -O2 -mhard-float fpee.c -o fpee
or1k-elf-sim -f /opt/or1k/sim.cfg ./fpee

# Expected results
# Program Header: PT_LOAD, vaddr: 0x00000000, paddr: 0x0 offset: 0x00002000, filesz: 0x000065ab, memsz: 0x000065ab
# Program Header: PT_LOAD, vaddr: 0x000085ac, paddr: 0x85ac offset: 0x000085ac, filesz: 0x000000c8, memsz: 0x0000046c
# WARNING: sim_init: Debug module not enabled, cannot start remote service to GDB
# Exceptions enabled, now DIV 3.14 / 0!
# Got FPU Exception, PC: 0x2068
# Result: f
# FPCSR: 801

# Compile the program to run in USER_MODE
or1k-elf-gcc -g -O2 -mhard-float -DUSER_MODE fpee.c -o fpee
or1k-elf-sim -f /opt/or1k/sim.cfg ./fpee

# Expected results with USER_MODE
# Program Header: PT_LOAD, vaddr: 0x00000000, paddr: 0x0 offset: 0x00002000, filesz: 0x000065ab, memsz: 0x000065ab
# Program Header: PT_LOAD, vaddr: 0x000085ac, paddr: 0x85ac offset: 0x000085ac, filesz: 0x000000c8, memsz: 0x0000046c
# WARNING: sim_init: Debug module not enabled, cannot start remote service to GDB
# Enabling user mode
# Exceptions enabled, now DIV 3.14 / 0!
# Got FPU Exception, PC: 0x2068
# Result: f
# FPCSR: 801
# exit(0)
In the above we can see how to compile and run a simple FPU test program and run
it on or1ksim. The program set’s up an FPU exception handler, enables exceptions
then does a divide by zero to produce an exception. This program uses the
OpenRISC newlib (baremetal) toolchain to
compile a program that can run directly on the simulator, as oppposed to a
program running in an OS on a simulator or hardware.
Note, that normally newlib programs expect to run in supervisor mode, when
our program switches to user mode we need to take some precautions to ensure it
can run correctly. As noted in the comments, usually when allocating and exiting
the newlib runtime will do things like disabling/enabling interrupts which
will fail when running in user mode.
QEMU Updates
The QEMU update was done in my
OpenRISC user space FPCSR
qemu patch series. The series was merged for the
qemu 8.1 release.
The updates were split it into three changes:
- Allowing FPCSR access in user mode.
- Properly set the exception PC address on floating point exceptions.
- Configuring the QEMU softfloat implementation to perform tininess check
before rounding.
QEMU Patch 1
The first patch to allow FPCSR access in user mode was trivial, but required some
code structure changes making the patch look bigger than it really was.
QEMU Patch 2
The next patch to properly set the exception PC address fixed a long existing
bug where the EPCR was not properly updated after FPU exceptions. Up until now
OpenRISC userspace did not support FPU instructions and this code path had not
been tested.
To explain why this fix is important let us look at the EPCR and what it is used for
in a bit more detail.
In general, when an exception occurs an OpenRISC CPU will store the program counter (PC)
of the instruction that caused the exception into the exeption program counter address
(EPCR). Floating point exceptions are a special case in that the EPCR is
actually set to the next instruction to be executed, this is to avoid looping.
When the linux kernel handles a floating point exception it follows the path
0xd00 > fpe_trap_handler > do_fpe_trap. This will setup a
signal to be delivered to the user process.
The Linux OS uses the EPCR to report the exception instruction address to
userspace via a signal which we can see being done in do_fpe_trap which
we can see below:
asmlinkage void do_fpe_trap(struct pt_regs *regs, unsigned long address)
{
	int code = FPE_FLTUNK;
	unsigned long fpcsr = regs->fpcsr;

	if (fpcsr & SPR_FPCSR_IVF)
		code = FPE_FLTINV;
	else if (fpcsr & SPR_FPCSR_OVF)
		code = FPE_FLTOVF;
	else if (fpcsr & SPR_FPCSR_UNF)
		code = FPE_FLTUND;
	else if (fpcsr & SPR_FPCSR_DZF)
		code = FPE_FLTDIV;
	else if (fpcsr & SPR_FPCSR_IXF)
		code = FPE_FLTRES;

	/* Clear all flags */
	regs->fpcsr &= ~SPR_FPCSR_ALLF;

	force_sig_fault(SIGFPE, code, (void __user *)regs->pc);
}
Here we see the excption becomes a SIGFPE signal and the exception address in
regs->pc is passed to force_sig_fault. The PC will be used to set the
si_addr field of the siginfo_t structure.
Next upon return from kernel space to user space the path is do_fpe_trap >
_fpe_trap_handler > ret_from_exception > resume_userspace >
work_pending > do_work_pending > restore_all.
Inside of do_work_pending with there the signal handling is done. In explain a bit
about this in the article Unwinding a Bug - How C++ Exceptions Work.
In restore_all we see EPCR is returned to when exception handling is
complete. A snipped of this code is show below:
#define RESTORE_ALL                     \
    DISABLE_INTERRUPTS(r3,r4)               ;\
    l.lwz   r3,PT_PC(r1)                    ;\
    l.mtspr r0,r3,SPR_EPCR_BASE             ;\
    l.lwz   r3,PT_SR(r1)                    ;\
    l.mtspr r0,r3,SPR_ESR_BASE              ;\
    l.lwz   r3,PT_FPCSR(r1)                 ;\
    l.mtspr r0,r3,SPR_FPCSR                 ;\
    l.lwz   r2,PT_GPR2(r1)                  ;\
    l.lwz   r3,PT_GPR3(r1)                  ;\
    l.lwz   r4,PT_GPR4(r1)                  ;\
    l.lwz   r5,PT_GPR5(r1)                  ;\
    l.lwz   r6,PT_GPR6(r1)                  ;\
    l.lwz   r7,PT_GPR7(r1)                  ;\
    l.lwz   r8,PT_GPR8(r1)                  ;\
    l.lwz   r9,PT_GPR9(r1)                  ;\
    l.lwz   r10,PT_GPR10(r1)                    ;\
    l.lwz   r11,PT_GPR11(r1)                    ;\
    l.lwz   r12,PT_GPR12(r1)                    ;\
    l.lwz   r13,PT_GPR13(r1)                    ;\
    l.lwz   r14,PT_GPR14(r1)                    ;\
    l.lwz   r15,PT_GPR15(r1)                    ;\
    l.lwz   r16,PT_GPR16(r1)                    ;\
    l.lwz   r17,PT_GPR17(r1)                    ;\
    l.lwz   r18,PT_GPR18(r1)                    ;\
    l.lwz   r19,PT_GPR19(r1)                    ;\
    l.lwz   r20,PT_GPR20(r1)                    ;\
    l.lwz   r21,PT_GPR21(r1)                    ;\
    l.lwz   r22,PT_GPR22(r1)                    ;\
    l.lwz   r23,PT_GPR23(r1)                    ;\
    l.lwz   r24,PT_GPR24(r1)                    ;\
    l.lwz   r25,PT_GPR25(r1)                    ;\
    l.lwz   r26,PT_GPR26(r1)                    ;\
    l.lwz   r27,PT_GPR27(r1)                    ;\
    l.lwz   r28,PT_GPR28(r1)                    ;\
    l.lwz   r29,PT_GPR29(r1)                    ;\
    l.lwz   r30,PT_GPR30(r1)                    ;\
    l.lwz   r31,PT_GPR31(r1)                    ;\
    l.lwz   r1,PT_SP(r1)                    ;\
    l.rfe
Here we can see how l.mtspr r0,r3,SPR_EPCR_BASE restores the EPCR to the pc
address stored in pt_regs when we entered the exception handler. All
other register are restored and finally the l.rfe instruction is issued to
return from the exception which affectively jumps to EPCR.
The reason QEMU was not setting the correct exception address is due to the way
qemu is implemented which optimizes performance. QEMU executes target code
basic blocks that are translated to host native instructions, during runtime
all PC addresses are those of the host, for example x86-64 64-bit
addresses. When an exception occurs, updating the target PC address from the host PC
need to be explicityly requested.
QEMU Patch 3
The next patch to implement tininess before rouding was also trivial but
brought up a conversation about default NaN payloads.
QEMU Patch 4
Wait, there is more. During writing this article I realized that if QEMU
was setting the ECPR to the FPU instruction causing the exception then
we would end up in an endless loop.
Luckily the arcitecture anticipated this calling for FPU exceptions to set the next
instruction to be executed to EPCR. QEMU was missing this logic.
The patch target/openrisc: Set EPCR to next PC on FPE exceptions
fixes this up.
RTL Updates
Updating the actual verilog RTL CPU implementations also needed to be done.
Updates have been made to both the mor1kx
and the
or1k_marocchino
implementations.
mor1kx Updates
Updates to the mor1kx to support user mode reads and write to the FPCSR were done in the patch:
Make FPCSR is R/W accessible for both user- and supervisor- modes.
The full patch is:
@@ -618,7 +618,7 @@ module mor1kx_ctrl_cappuccino
            spr_fpcsr[`OR1K_FPCSR_FPEE] <= 1'b0;
          end
          else if ((spr_we & spr_access[`OR1K_SPR_SYS_BASE] &
-                  (spr_sr[`OR1K_SPR_SR_SM] & padv_ctrl | du_access)) &&
+                  (padv_ctrl | du_access)) &&
                   `SPR_OFFSET(spr_addr)==`SPR_OFFSET(`OR1K_SPR_FPCSR_ADDR)) begin
            spr_fpcsr <= spr_write_dat[`OR1K_FPCSR_WIDTH-1:0]; // update all fields
           `ifdef OR1K_FPCSR_MASK_FLAGS
The change to verilog shows that before when writng (spr_we) to the FPCSR (OR1K_SPR_FPCSR_ADDR) register
we used to check that the supervisor bit (OR1K_SPR_SR_SM) bit of the sr spr (spr_sr) is set. That check
enforced supervisor mode only write access, removing this allows user space to write to the regsiter.
Updating mor1kx to support tininess checking before rounding was done in the
change Refactoring and implementation tininess detection before
rounding.
I will not go into the details of these patches as I don’t understand them so
much.
Marocchino Updates
Updates to the or1k_marocchino to support user mode reads and write to the FPCSR were done in the patch:
Make FPCSR is R/W accessible for both user- and supervisor- modes.
The full patch is:
@@ -714,7 +714,7 @@ module or1k_marocchino_ctrl
  assign except_fpu_enable_o = spr_fpcsr[`OR1K_FPCSR_FPEE];

  wire spr_fpcsr_we = (`SPR_OFFSET(({1'b0, spr_sys_group_wadr_r})) == `SPR_OFFSET(`OR1K_SPR_FPCSR_ADDR)) &
-                      spr_sys_group_we &  spr_sr[`OR1K_SPR_SR_SM];
+                      spr_sys_group_we; // FPCSR is R/W for both user- and supervisor- modes

 `ifdef OR1K_FPCSR_MASK_FLAGS
  reg [`OR1K_FPCSR_ALLF_SIZE-1:0] ctrl_fpu_mask_flags_r;
Updating the marocchino to support dttectig tininess before rounding was done in the
patch:
Refactoring FPU Implementation for tininess detection BEFORE ROUNDING.
I will not go into details of the patch as I didn’t write them. In
general it is a medium size refactoring of the floating point unit.
Summary
We discussed updates to the architecture simulators and verilog CPU implementations
to allow supporting user mode floating point programs. These updates will now allow us to
port Linux and glibc to the OpenRISC floating point unit.
Further Reading
25 Apr 2023
Last year (2022) the big milestone for OpenRISC was getting the glibc port upstream.
Though there is libc support for
OpenRISC already with musl and ucLibc
the glibc port provides a extensive testsuite which has proved useful in shaking out toolchain
and OS bugs.
The upstreamed OpenRISC glibc support is missing support for leveraging the
OpenRISC floating-point unit (FPU).
Adding OpenRISC glibc FPU support requires a cross cutting effort across the
architecture’s fullstack from:
- Architecture Specification
- Simulators and CPU implementations
- Linux Kernel support
- GCC Instructions and Soft FPU
- Binutils/GDB Debugging Support
- glibc support
In this blog entry I will cover how the OpenRISC architecture specification
was updated to support user space floating point applications. But first, what
is FPU porting?
What is FPU Porting?
The FPU in modern CPU’s allow the processor to perform IEEE 754
floating point math like addition, subtraction, multiplication. When used in a
user application the FPU’s function becomes more of a math accelerator, speeding
up math operations including
trigonometric and
complex functions such as sin,
sinf and cexpf. Not all FPU’s provide the same
set of FPU operations nor do they have to. When enabled, the compiler will
insert floating point instructions where they can be used.
OpenRISC FPU support was added to the GCC compiler a while back.
We can see how this works with a simple example using the bare-metal newlib toolchain.
C code example addf.c:
float addf(float a, float b) {
    return a + b;
}
To compile this C function we can do:
$ or1k-elf-gcc -O2 addf.c -c -o addf-sf.o
$ or1k-elf-gcc -O2 -mhard-float addf.c -c -o addf-hf.o
Assembly output of addf-sf.o contains the default software floating point
implementation as we can see below. We can see below that a call to __addsf3 was
added to perform our floating point operation. The function __addsf3
is provided
by libgcc as a software implementation of the single precision
floating point (sf) add operation.
$ or1k-elf-objdump -dr addf-sf.o

Disassembly of section .text:

00000000 <addf>:
   0:   9c 21 ff fc     l.addi r1,r1,-4
   4:   d4 01 48 00     l.sw 0(r1),r9
   8:   04 00 00 00     l.jal 8 <addf+0x8>
                        8: R_OR1K_INSN_REL_26   __addsf3
   c:   15 00 00 00     l.nop 0x0
  10:   85 21 00 00     l.lwz r9,0(r1)
  14:   44 00 48 00     l.jr r9
  18:   9c 21 00 04     l.addi r1,r1,4
The disassembly of the addf-hf.o below shows that the FPU instruction
(hardware) lf.add.s is used to perform addition, this is because the snippet
was compiled using the -mhard-float argument. One could imagine if this is
supported it would be more efficient compared to the software implementation.
$ or1k-elf-objdump -dr addf-hf.o

Disassembly of section .text:

00000000 <addf>:
   0:   c9 63 20 00     lf.add.s r11,r3,r4
   4:   44 00 48 00     l.jr r9
   8:   15 00 00 00     l.nop 0x0
So if the OpenRISC toolchain already has support for FPU instructions what else
needs to be done? When we add FPU support to glibc we are adding FPU support
to the OpenRISC POSIX runtime and create a toolchain that can compile and link
binaries to run on this runtime.
The Runtime
Below we can see examples of two application runtimes, one Application A runs
with software floating point, the other Application B run’s with full hardware
floating point.
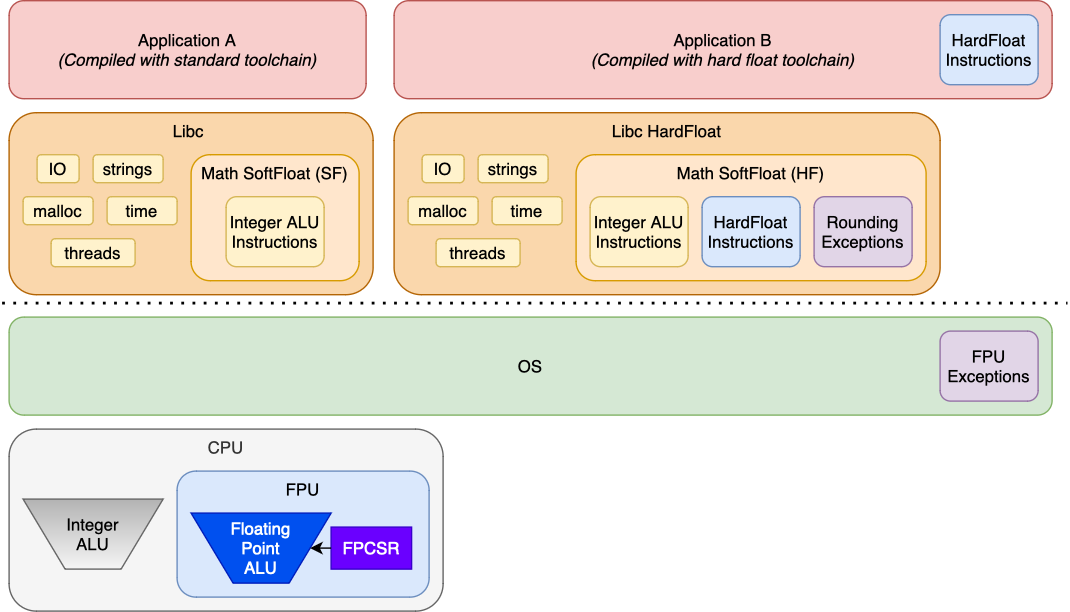
Both Application A and Application B can run on the same system, but
Application B requires a libc and kernel that support the floating point
runtime. As we can see:
- In Application B it leverages floating point instructions as noted in the
blue box. That should be implemented in the
CPU, and are produced by the GCC compiler.
- The math routines in the C Library used by Application B are accelarated by
the FPU as per the blue box. The math routines can also set up rounding of the FPU hardware to
be in line with rounding of the software routines. The math routines can
also detect exceptions by checking the FPU state. The rounding and exception
handling in the purple boxes is what is
implemented the GLIBC.
- The kernel must be able to save and restore the FPU state when switching
between processes. The OS also has support for signalling the process if
enabled. This is indicated in the purple
box.
Another aspect is that supporting hardware floating point in the OS means that
multiple user land programs can transparently use the FPU. To do all of this we
need to update the kernel and the C runtime libraries to:
- Make the kernel save and restore process FPU state during context switches
- Make the kernel handle FPU exceptions and deliver signals to user land
- Teach GLIBC how to setup FPU rounding mode
- Teach GLIBC how to translate FPU exceptions
- Tell GCC and GLIBC soft float about our FPU quirks
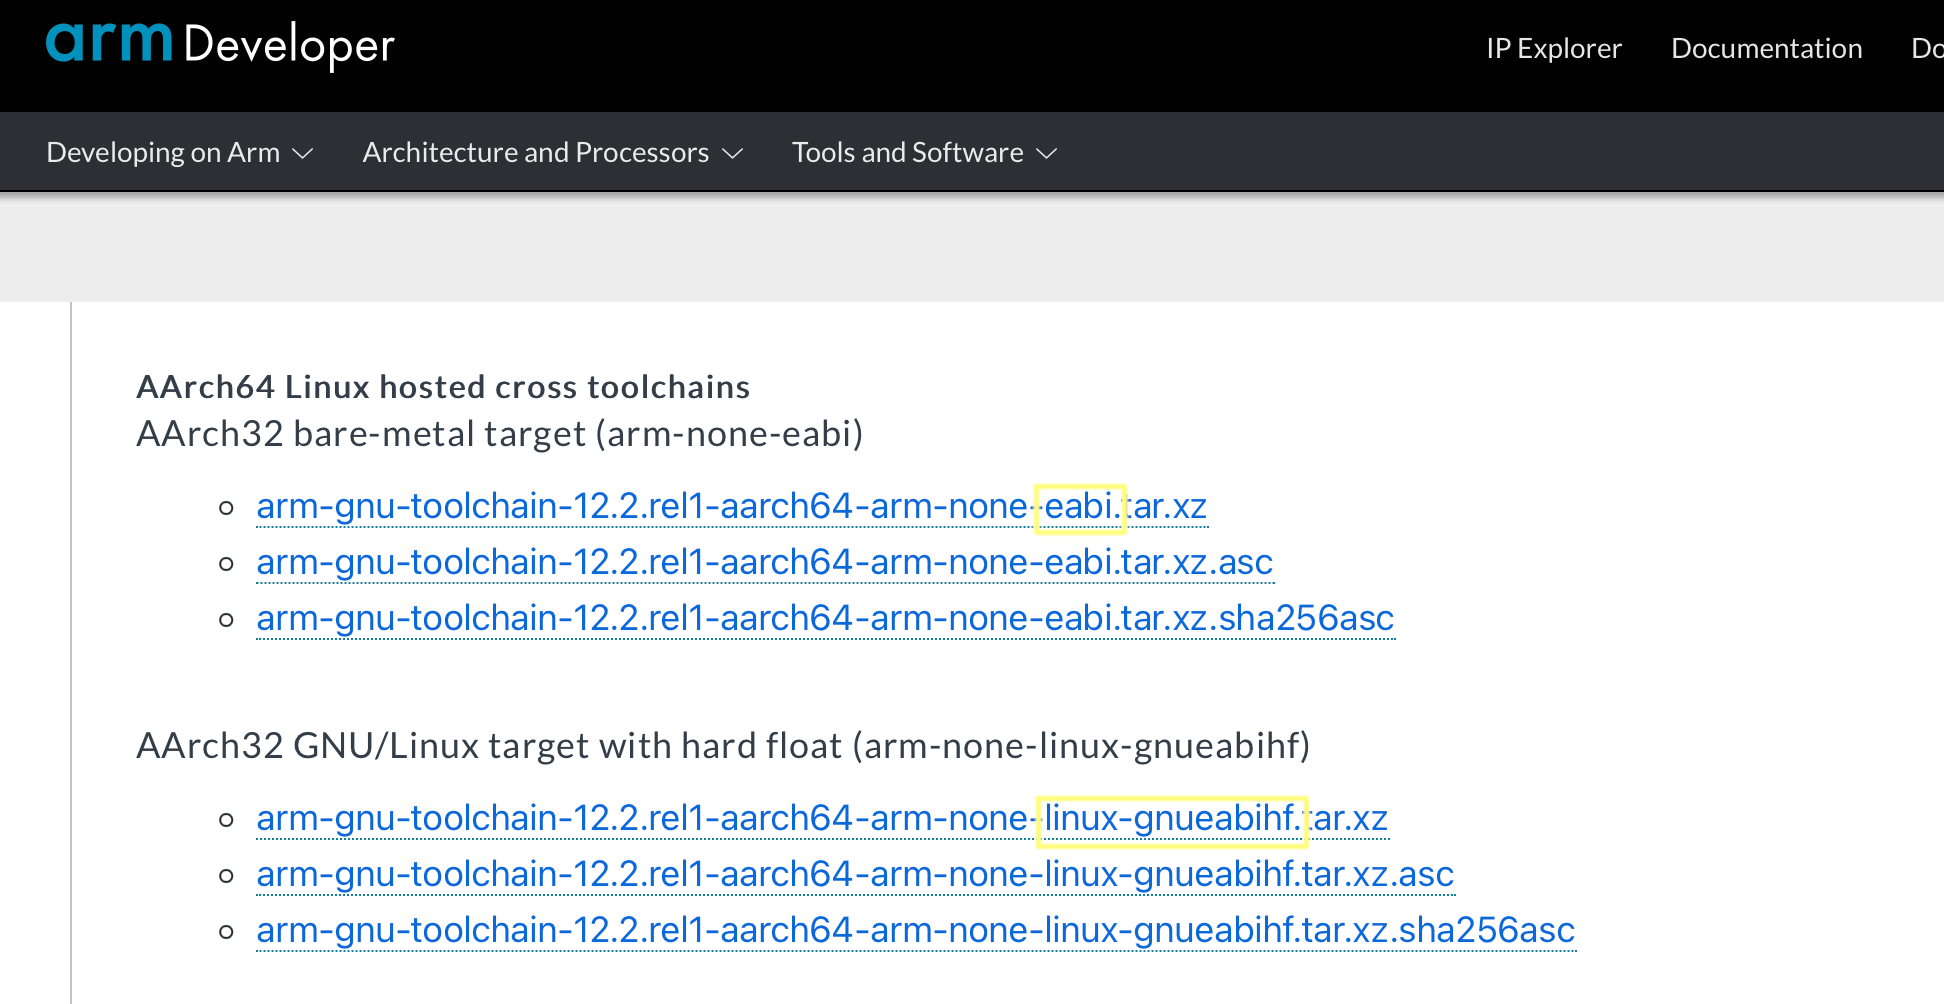
In order to compile applications like Application B a separate compiler
toolchain is needed. For highly configurable embredded system CPU’s like ARM, RISC-V there
are multiple toolchains available for building software for the different CPU
configurations. Usually there will be one toolchain for soft float and one for hard float support, see the below example
from the arm toolchain download page.
Fixing Architecture Issues
As we started to work on the floating point support we found two issues:
- The OpenRISC floating point control and status register (FPCSR) is accessible only in
supervisor mode.
- We have not defined how the FPU should perform tininess detection.
FPCSR Access
The GLIBC OpenRISC FPU port, or any port for that matter, starts
by looking at what other architectures have done. For GLIBC FPU support we can
look at what MIPS, ARM, RISC-V etc. have implemented. Most ports have a file
called sysdeps/{arch}/fpu_control.h, I noticed one thing right away as I went
through this, we can look at ARM or MIPS for example:
sysdeps/mips/fpu_control.h:
Excerpt from the MIPS port showing the definition of _FPU_GETCW and _FPU_SETCW
 #else
 # define _FPU_GETCW(cw) __asm__ volatile ("cfc1 %0,$31" : "=r" (cw))
 # define _FPU_SETCW(cw) __asm__ volatile ("ctc1 %0,$31" : : "r" (cw))
 #endif
sysdeps/arm/fpu_control.h:
Excerpt from the ARM port showing the definition of _FPU_GETCW and _FPU_SETCW
 # define _FPU_GETCW(cw) \
   __asm__ __volatile__ ("vmrs %0, fpscr" : "=r" (cw))
 # define _FPU_SETCW(cw) \
   __asm__ __volatile__ ("vmsr fpscr, %0" : : "r" (cw))
 #endif
What we see here is a macro that defines how to read or write the floating point
control word for each architecture. The macros are implemented using a single
assembly instruction.
In OpenRISC we have similar instructions for reading and writing the floating
point control register (FPCSR), writing for example is: l.mtspr r0,%0,20. However,
on OpenRISC the FPCSR is read-only when running in user-space, this is a
problem.
If we remember from our operating system studies, user applications run in
user-mode as
apposed to the privileged kernel-mode.
The user floating point environment
is defined by POSIX in the ISO C Standard. The C library provides functions to
set rounding modes and clear exceptions using for example
fesetround
for setting FPU rounding modes and
feholdexcept for clearing exceptions.
If userspace applications need to be able to control the floating point unit
the having architectures support for this is integral.
Originally OpenRISC architecture specification
specified the floating point control and status registers (FPCSR) as being
read only when executing in user mode, again this is a problem and needs to
be addressed.
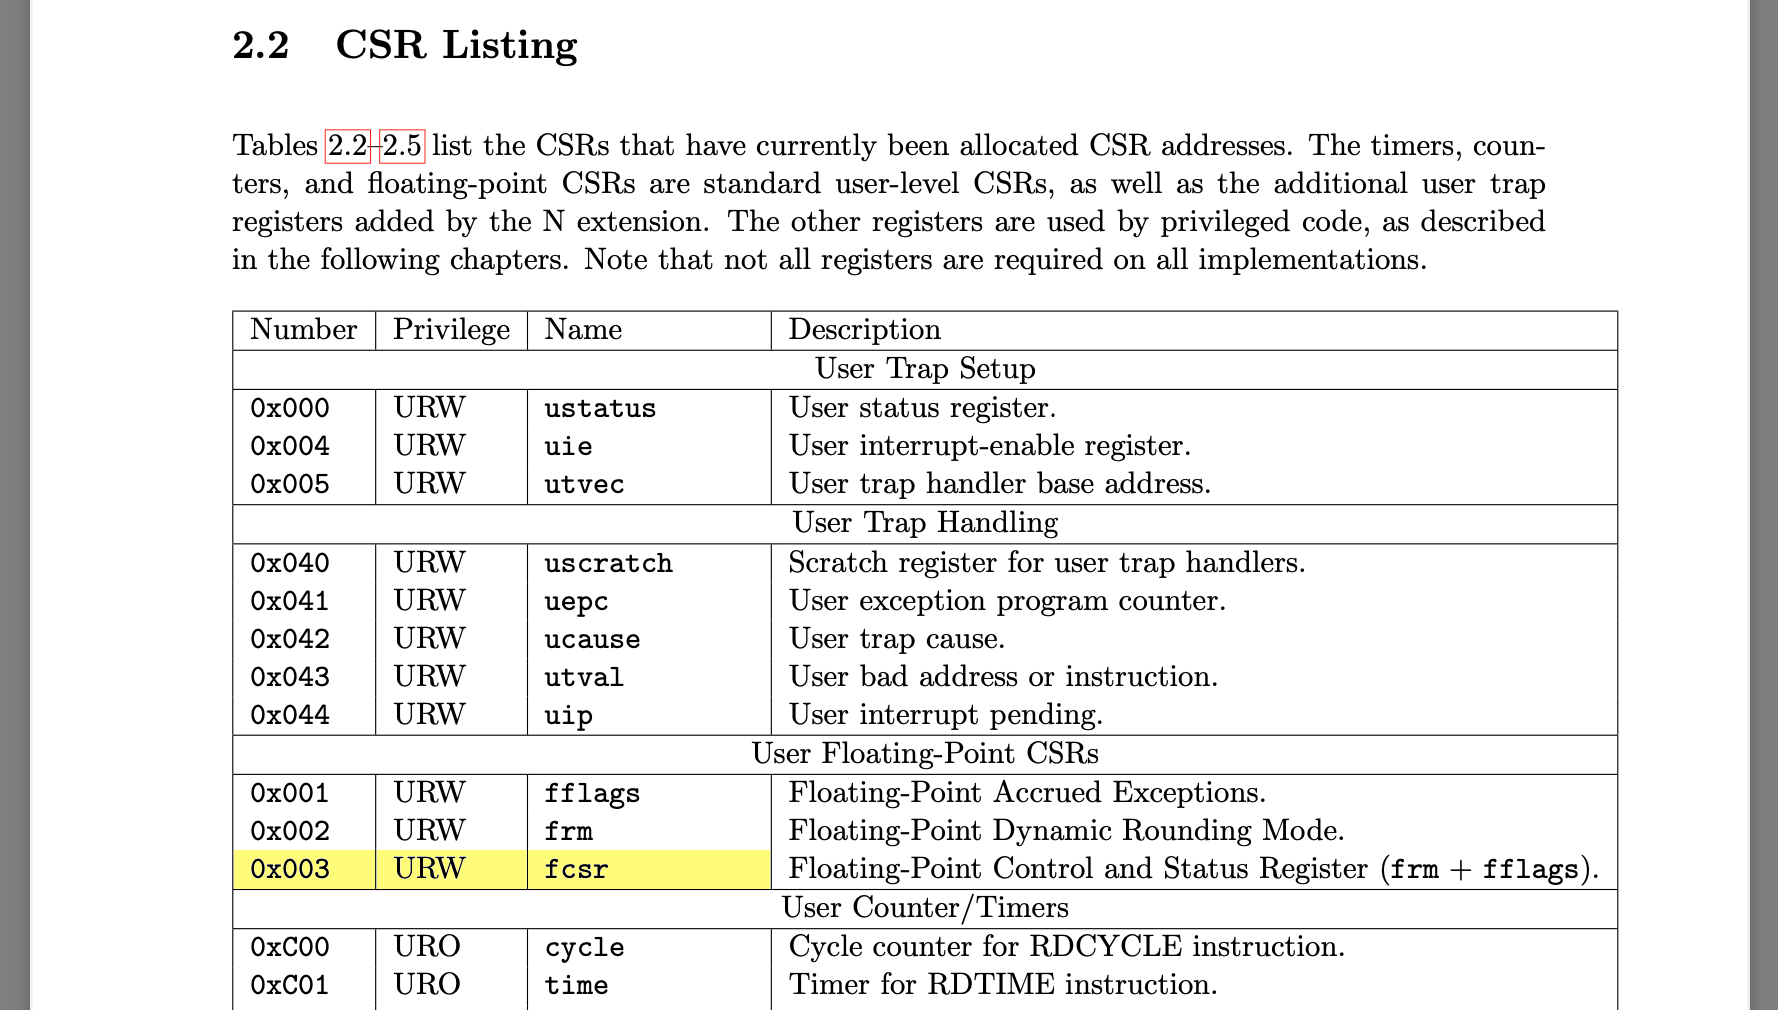
Other architectures define the floating point control register as being writable in user-mode.
For example, ARM has the
FPCR and FPSR,
and RISC-V has the
FCSR
all of which are writable in user-mode.
Tininess Detection
I am skipping ahead a bit here, once the OpenRISC GLIBC port was working we noticed
many problematic math test failures. This turned out to be inconsistencies
between the tininess detection [pdf]
settings in the toolchain. Tininess detection must be selected by an FPU
implementation as being done before or after rounding.
In the toolchain this is configured by:
- GLIBC
TININESS_AFTER_ROUNDING - macro used by test suite to control
expectations
- GLIBC
_FP_TININESS_AFTER_ROUNDING - macro used to control softfloat
implementation in GLIBC.
- GCC libgcc
_FP_TININESS_AFTER_ROUNDING - macro used to control softfloat
implementation in GCC libgcc.
Updating the Spec
Writing to FPCSR from user-mode could be worked around in OpenRISC by
introducing a syscall, but we decided to just change the architecture
specification for this. Updating the spec keeps it similar to all other
architectures out there.
In OpenRISC we have defined tininess detection to be done before rounding as
this matches what existing FPU implementation have done.
As of architecture specification revision
1.4 the FPCSR is defined as being writable
in user-mode and we have documented tininess detection to be before rounding.
Summary
We’ve gone through an overview of how the FPU accelarates math in
an application runtime. We then looked how the OpenRISC architecture specification needed
to be updated to support the floating point POSIX runtime.
In the next entry we shall look into patches to get QEMU and and CPU
implementations updated to support the new spec changes.
13 Dec 2020
I have been working on porting GLIBC to the OpenRISC architecture. This has
taken longer than I expected as with GLIBC upstreaming we must get every
test to pass. This was different compared to GDB and GCC which were a
bit more lenient.
My first upstreaming attempt
was completely tested on the QEMU simulator. I have
since added an FPGA LiteX SoC
to my test platform options. LiteX runs Linux on the OpenRISC mor1kx softcore
and tests are loaded over an SSH session. The SoC eliminates an issue I was
seeing on the simulator where under heavy load it appears the MMU starves the kernel
from getting any work done.
To get to where I am now this required:
Adding GDB Linux debugging support is great because it allows debugging of
multithreaded processes and signal handling; which we are going to need.
A Bug
Our story starts when I was trying to fix a failing GLIBC NPTL
test case. The test case involves C++ exceptions and POSIX threads.
The issue is that the catch block of a try/catch block is not
being called. Where do we even start?
My plan for approaching test case failures is:
- Understand what the test case is trying to test and where its failing
- Create a hypothesis about where the problem is
- Understand how the failing API’s works internally
- Debug until we find the issue
- If we get stuck go back to
2.
Let’s have a try.
Understanding the Test case
The GLIBC test case is nptl/tst-cancel24.cc.
The test starts in the do_test function and it will create a child thread with pthread_create.
The child thread executes function tf which waits on a semaphore until the parent thread cancels it. It
is expected that the child thread, when cancelled , will call it’s catch block.
The failure is that the catch block is not getting run as evidenced by the except_caught variable
not being set to true.
Below is an excerpt from the test showing the tf function.
static void *
tf (void *arg) {
  sem_t *s = static_cast<sem_t *> (arg);

  try {
      monitor m;

      pthread_barrier_wait (&b);

      while (1)
        sem_wait (s);
  } catch (...) {
      except_caught = true;
      throw;
  }
  return NULL;
}
So the catch block is not being run. Simple, but where do we start to
debug that? Let’s move onto the next step.
Creating a Hypothesis
This one is a bit tricky as it seems C++ try/catch blocks are broken. Here, I am
working on GLIBC testing, what does that have to do with C++?
To get a better idea of where the problem is I tried to modify the test to test
some simple ideas. First, maybe there is a problem with catching exceptions
throws from thread child functions.
static void do_throw() { throw 99; }

static void * tf () {
  try {
      monitor m;
      while (1) do_throw();
  } catch (...) {
      except_caught = true;
  }
  return NULL;
}
No, this works correctly. So try/catch is working.
Hypothesis: There is a problem handling exceptions while in a syscall.
There may be something broken with OpenRISC related to how we setup stack
frames for syscalls that makes the unwinder fail.
How does that work? Let’s move onto the next step.
Understanding the Internals
To find this bug we need to understand how C++ exceptions work. Also, we need to know
what happens when a thread is cancelled in a multithreaded
(pthread) glibc environment.
There are a few contributors pthread cancellation and C++ exceptions which are:
- DWARF - provided by our program and libraries in the
.eh_frame ELF
section
- GLIBC - provides the pthread runtime and cleanup callbacks to the GCC unwinder code
- GCC - provides libraries for dealing with exceptions
libgcc_s.so - handles unwinding by reading program DWARF metadata and doing the frame decodinglibstdc++.so.6 - provides the C++ personality routine which
identifies and prepares catch blocks for execution
DWARF
ELF binaries provide debugging information in a data format called
DWARF. The name was chosen to maintain a
fantasy theme. Lately the Linux community has a new debug format called
ORC.
Though DWARF is a debugging format and usually stored in .debug_frame,
.debug_info, etc sections, a stripped down version it is used for exception
handling.
Each ELF binary that supports unwinding contains the .eh_frame section to
provide unwinding information. This can be seen with the readelf program.
$ readelf -S sysroot/lib/libc.so.6
There are 70 section headers, starting at offset 0xaa00b8:

Section Headers:
  [Nr] Name              Type            Addr     Off    Size   ES Flg Lk Inf Al
  [ 0]                   NULL            00000000 000000 000000 00      0   0  0
  [ 1] .note.ABI-tag     NOTE            00000174 000174 000020 00   A  0   0  4
  [ 2] .gnu.hash         GNU_HASH        00000194 000194 00380c 04   A  3   0  4
  [ 3] .dynsym           DYNSYM          000039a0 0039a0 008280 10   A  4  15  4
  [ 4] .dynstr           STRTAB          0000bc20 00bc20 0054d4 00   A  0   0  1
  [ 5] .gnu.version      VERSYM          000110f4 0110f4 001050 02   A  3   0  2
  [ 6] .gnu.version_d    VERDEF          00012144 012144 000080 00   A  4   4  4
  [ 7] .gnu.version_r    VERNEED         000121c4 0121c4 000030 00   A  4   1  4
  [ 8] .rela.dyn         RELA            000121f4 0121f4 00378c 0c   A  3   0  4
  [ 9] .rela.plt         RELA            00015980 015980 000090 0c  AI  3  28  4
  [10] .plt              PROGBITS        00015a10 015a10 0000d0 04  AX  0   0  4
  [11] .text             PROGBITS        00015ae0 015ae0 155b78 00  AX  0   0  4
  [12] __libc_freeres_fn PROGBITS        0016b658 16b658 001980 00  AX  0   0  4
  [13] .rodata           PROGBITS        0016cfd8 16cfd8 0192b4 00   A  0   0  4
  [14] .interp           PROGBITS        0018628c 18628c 000018 00   A  0   0  1
  [15] .eh_frame_hdr     PROGBITS        001862a4 1862a4 001a44 00   A  0   0  4
  [16] .eh_frame         PROGBITS        00187ce8 187ce8 007cf4 00   A  0   0  4
  [17] .gcc_except_table PROGBITS        0018f9dc 18f9dc 000341 00   A  0   0  1
...
We can decode the metadata using readelf as well using the
--debug-dump=frames-interp and --debug-dump=frames arguments.
The frames dump provides a raw output of the DWARF metadata for each frame.
This is not usually as useful as frames-interp, but it shows how the DWARF
format is actually a bytecode. The DWARF interpreter needs to execute these
operations to understand how to derive the values of registers based current PC.
There is an interesting talk in Exploiting the hard-working
DWARF.pdf.
An example of the frames dump:
$ readelf --debug-dump=frames sysroot/lib/libc.so.6

...
00016788 0000000c ffffffff CIE
  Version:               1
  Augmentation:          ""
  Code alignment factor: 4
  Data alignment factor: -4
  Return address column: 9

  DW_CFA_def_cfa_register: r1
  DW_CFA_nop

00016798 00000028 00016788 FDE cie=00016788 pc=0016b584..0016b658
  DW_CFA_advance_loc: 4 to 0016b588
  DW_CFA_def_cfa_offset: 4
  DW_CFA_advance_loc: 8 to 0016b590
  DW_CFA_offset: r9 at cfa-4
  DW_CFA_advance_loc: 68 to 0016b5d4
  DW_CFA_remember_state
  DW_CFA_def_cfa_offset: 0
  DW_CFA_restore: r9
  DW_CFA_restore_state
  DW_CFA_advance_loc: 56 to 0016b60c
  DW_CFA_remember_state
  DW_CFA_def_cfa_offset: 0
  DW_CFA_restore: r9
  DW_CFA_restore_state
  DW_CFA_advance_loc: 36 to 0016b630
  DW_CFA_remember_state
  DW_CFA_def_cfa_offset: 0
  DW_CFA_restore: r9
  DW_CFA_restore_state
  DW_CFA_advance_loc: 40 to 0016b658
  DW_CFA_def_cfa_offset: 0
  DW_CFA_restore: r9
The frames-interp argument is a bit more clear as it shows the interpreted output
of the bytecode. Below we see two types of entries:
CIE - Common Information EntryFDE - Frame Description Entry
The CIE provides starting point information for each child FDE entry. Some
things to point out: we see ra=9 indicates the return address is stored in
register r9, we see CFA r1+0 indicates the canonical frame pointer is stored in
register r1 and we see the stack frame size is 4 bytes.
An example of the frames-interp dump:
$ readelf --debug-dump=frames-interp sysroot/lib/libc.so.6

...
00016788 0000000c ffffffff CIE "" cf=4 df=-4 ra=9
   LOC   CFA
00000000 r1+0

00016798 00000028 00016788 FDE cie=00016788 pc=0016b584..0016b658
   LOC   CFA      ra
0016b584 r1+0     u
0016b588 r1+4     u
0016b590 r1+4     c-4
0016b5d4 r1+4     c-4
0016b60c r1+4     c-4
0016b630 r1+4     c-4
0016b658 r1+0     u
GLIBC
GLIBC provides pthreads which when used with C++ needs to support exception
handling. The main place exceptions are used with pthreads is when cancelling
threads. When using pthread_cancel a cancel signal is sent to the target thread using tgkill
which causes an exception.
This is implemented with the below APIs.
- sigcancel_handler -
Setup during the pthread runtime initialization, it handles cancellation,
which calls
__do_cancel, which calls __pthread_unwind.
- __pthread_unwind -
Is called with
pd->cancel_jmp_buf. It calls glibc’s __Unwind_ForcedUnwind.
- _Unwind_ForcedUnwind -
Loads GCC’s
libgcc_s.so version of _Unwind_ForcedUnwind
and calls it with parameters:
exc - the exception contextunwind_stop - the stop callback to GLIBC, called for each frame of the unwind, with
the stop argument ibufibuf - the jmp_buf, created by setjmp (self->cancel_jmp_buf) in start_thread
- unwind_stop -
Checks the current state of unwind and call the
cancel_jmp_buf if
we are at the end of stack. When the cancel_jmp_buf is called the thread
exits.
Let’s look at pd->cancel_jmp_buf in more details. The cancel_jmp_buf is
setup during pthread_create after clone in start_thread.
It uses the setjmp and
longjump non local goto mechanism.
Let’s look at some diagrams.
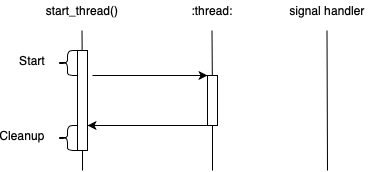
The above diagram shows a pthread that exits normally. During the Start phase
of the thread setjmp will create the cancel_jmp_buf. After the thread
routine exits it returns to the start_thread routine to do cleanup.
The cancel_jmp_buf is not used.
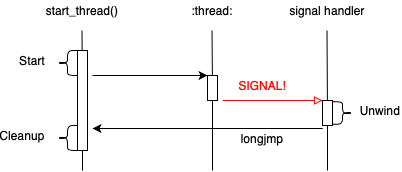
The above diagram shows a pthread that is cancelled. When the
thread is created setjmp will create the cancel_jmp_buf. In this case
while the thread routine is running it is cancelled, the unwinder runs
and at the end it calls unwind_stop which calls longjmp. After the
longjmp the thread is returned to start_thread to do cleanup.
A highly redacted version of our start_thread and unwind_stop functions is
shown below.
start_thread()
{
  struct pthread *pd = START_THREAD_SELF;
  ...
  struct pthread_unwind_buf unwind_buf;

  int not_first_call;
  not_first_call = setjmp ((struct __jmp_buf_tag *) unwind_buf.cancel_jmp_buf);
  ...
  if (__glibc_likely (! not_first_call))
    {
      /* Store the new cleanup handler info.  */
      THREAD_SETMEM (pd, cleanup_jmp_buf, &unwind_buf);
      ...

      /* Run the user provided thread routine */
      ret = pd->start_routine (pd->arg);
      THREAD_SETMEM (pd, result, ret);
    }
  ... free resources ...
  __exit_thread ();
}
unwind_stop (_Unwind_Action actions,
	     struct _Unwind_Context *context, void *stop_parameter)
{
  struct pthread_unwind_buf *buf = stop_parameter;
  struct pthread *self = THREAD_SELF;
  int do_longjump = 0;
  ...

  if ((actions & _UA_END_OF_STACK)
      || ... )
    do_longjump = 1;

  ...
  /* If we are at the end, go back start_thread for cleanup */
  if (do_longjump)
    __libc_unwind_longjmp ((struct __jmp_buf_tag *) buf->cancel_jmp_buf, 1);

  return _URC_NO_REASON;
}
GCC
GCC provides the exception handling and unwinding capabilities
to the C++ runtime. They are provided in the libgcc_s.so and libstdc++.so.6 libraries.
The libgcc_s.so library implements the IA-64 Itanium Exception Handling ABI.
It’s interesting that the now defunct Itanium
architecture introduced this ABI which is now the standard for all processor exception
handling. There are two main entry points for the unwinder are:
_Unwind_ForcedUnwind - for forced unwinding_Unwind_RaiseException - for raising normal exceptions
There are also two data structures to be aware of:
- _Unwind_Context - register and unwind state for a frame, below referenced as CONTEXT
- _Unwind_FrameState - register and unwind state from DWARF, below referenced as FS
The _Unwind_Context important parts:
struct _Unwind_Context {
  _Unwind_Context_Reg_Val reg[__LIBGCC_DWARF_FRAME_REGISTERS__+1];
  void *cfa;
  void *ra;
  struct dwarf_eh_bases bases;
  _Unwind_Word flags;
};
The _Unwind_FrameState important parts:
typedef struct {
  struct frame_state_reg_info { ... } regs;
  void *pc;

  /* The information we care about from the CIE/FDE.  */
  _Unwind_Personality_Fn personality;
  _Unwind_Sword data_align;
  _Unwind_Word code_align;
  _Unwind_Word retaddr_column;
  unsigned char fde_encoding;
  unsigned char signal_frame;
  void *eh_ptr;
} _Unwind_FrameState;
These two data structures are very similar. The _Unwind_FrameState is for internal
use and closely ties to the DWARF definitions of the frame. The _Unwind_Context
struct is more generic and is used as an opaque structure in the public unwind api.
Forced Unwinds
Exceptions that are raised for thread cancellation use a single phase forced unwind.
Code execution will not resume, but catch blocks will be run. This is why
cancel exceptions must be rethrown.
Forced unwinds use the unwind_stop handler which GLIBC provides as explained in
the GLIBC section above.
- _Unwind_ForcedUnwind - calls:
_Unwind_ForcedUnwind_Phase2 - loops forever doing:
- uw_frame_state_for - populate FS for the frame one frame above CONTEXT, searching DWARF using CONTEXT->ra
stop- callback to GLIBC to stop the unwind if neededFS.personality - the C++ personality routine, see below, called with _UA_FORCE_UNWIND | _UA_CLEANUP_PHASE- uw_advance_context - advance CONTEXT by populating it from FS
Normal Exceptions
For exceptions raised programmatically unwinding is very similar to the forced unwind, but
there is no stop function and exception unwinding is 2 phase.
- _Unwind_RaiseException - calls:
uw_init_context - load details of the current frame from cpu/stack into CONTEXT- Do phase 1 loop:
uw_frame_state_for - populate FS for the frame one frame above CONTEXT, searching DWARF using CONTEXT->raFS.personality - the C++ personality routine, see below, called with _UA_SEARCH_PHASE- uw_update_context - advance CONTEXT by populating it from FS (same as
uw_advance_context)
- _Unwind_RaiseException_Phase2 - do the frame iterations
uw_install_context - exit unwinder jumping to selected frame
_Unwind_RaiseException_Phase2 - do phase 2, loops forever doing:
uw_frame_state_for - populate FS for the frame one frame above CONTEXT, searching DWARF using CONTEXT->raFS.personality - the C++ personality routine, called with _UA_CLEANUP_PHASEuw_update_context - advance CONTEXT by populating it from FS
The libstdc++.so.6 library provides the C++ standard library
which includes the C++ personality routine __gxx_personality_v0.
The personality routine is the interface between the unwind routines and the c++
(or other language) runtime, which handles the exception handling logic for that
language.
As we saw above the personality routine is executed for each stack frame. The
function checks if there is a catch block that matches the exception being
thrown. If there is a match, it will update the context to prepare it to jump
into the catch routine and return _URC_INSTALL_CONTEXT. If there is no catch
block matching it returns _URC_CONTINUE_UNWIND.
In the case of _URC_INSTALL_CONTEXT then the _Unwind_ForcedUnwind_Phase2
loop breaks and calls uw_install_context.
Unwinding through a Signal Frame
When the GCC unwinder is looping through frames the uw_frame_state_for
function will search DWARF information. The DWARF lookup will fail for signal
frames and a fallback mechanism is provided for each architecture to handle
this. For OpenRISC Linux this is handled by
or1k_fallback_frame_state.
To understand how this works let’s look into the Linux kernel a bit.
A process must be context switched to kernel by either a system call, timer or other
interrupt in order to receive a signal.
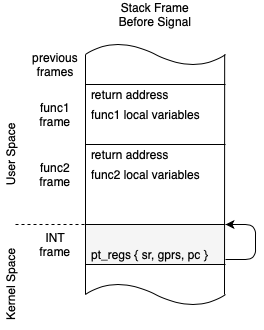
The diagram above shows what a process stack looks like after the kernel takes over.
An interrupt frame is push to the top of the stack and the pt_regs structure
is filled out containing the processor state before the interrupt.

This second diagram shows what happens when a signal handler is invoked. A new
special signal frame is pushed onto the stack and when the process is resumed
it resumes in the signal handler. In OpenRISC the signal frame is setup by the setup_rt_frame
function which is called inside of do_signal which calls handle_signal
which calls setup_rt_frame.
After the signal handler routine runs we return to a special bit of code called
the Trampoline. The trampoline code lives on the stack and runs
sigretrun.
Now back to or1k_fallback_frame_state.
The or1k_fallback_frame_state function checks if the current frame is a
signal frame by confirming the return address points to a Trampoline. If
it is a trampoline it looks into the kernel saved ucontext and pt_regs find
the previous user frame. Unwinding, can then continue as normal.
Debugging the Issue
Now with a good background in how unwinding works we can start to debug our test
case. We can recall our hypothesis:
Hypothesis: There is a problem handling exceptions while in a syscall.
There may be something broken with OpenRISC related to how we setup stack
frames for syscalls that makes the unwinder fail.
With GDB we can start to debug exception handling, we can trace right to the
start of the exception handling logic by setting our breakpoint at
_Unwind_ForcedUnwind.
This is the stack trace we see:
#0  _Unwind_ForcedUnwind_Phase2 (exc=0x30caf658, context=0x30caeb6c, frames_p=0x30caea90) at ../../../libgcc/unwind.inc:192
#1  0x30303858 in _Unwind_ForcedUnwind (exc=0x30caf658, stop=0x30321dcc <unwind_stop>, stop_argument=0x30caeea4) at ../../../libgcc/unwind.inc:217
#2  0x30321fc0 in __GI___pthread_unwind (buf=<optimized out>) at unwind.c:121
#3  0x30312388 in __do_cancel () at pthreadP.h:313
#4  sigcancel_handler (sig=32, si=0x30caec98, ctx=<optimized out>) at nptl-init.c:162
#5  sigcancel_handler (sig=<optimized out>, si=0x30caec98, ctx=<optimized out>) at nptl-init.c:127
#6  <signal handler called>
#7  0x303266d0 in __futex_abstimed_wait_cancelable64 (futex_word=0x7ffffd78, expected=1, clockid=<optimized out>, abstime=0x0, private=<optimized out>)
    at ../sysdeps/nptl/futex-internal.c:66
#8  0x303210f8 in __new_sem_wait_slow64 (sem=0x7ffffd78, abstime=0x0, clockid=0) at sem_waitcommon.c:285
#9  0x00002884 in tf (arg=0x7ffffd78) at throw-pthread-sem.cc:35
#10 0x30314548 in start_thread (arg=<optimized out>) at pthread_create.c:463
#11 0x3043638c in __or1k_clone () from /lib/libc.so.6
Backtrace stopped: frame did not save the PC
(gdb)
In the GDB backtrack we can see it unwinds through, the signal frame, sem_wait
all the way to our thread routine tf. It appears everything, is working fine.
But we need to remember the backtrace we see above is from GDB’s unwinder not
GCC, also it uses the .debug_info DWARF data, not .eh_frame.
To really ensure the GCC unwinder is working as expected we need to debug it
walking the stack. Debugging when we unwind a signal frame can be done by
placing a breakpoint on or1k_fallback_frame_state.
Debugging this code as well shows it works correctly.
#0  or1k_fallback_frame_state (context=<optimized out>, context=<optimized out>, fs=<optimized out>) at ../../../libgcc/unwind-dw2.c:1271
#1  uw_frame_state_for (context=0x30caeb6c, fs=0x30cae914) at ../../../libgcc/unwind-dw2.c:1271
#2  0x30303200 in _Unwind_ForcedUnwind_Phase2 (exc=0x30caf658, context=0x30caeb6c, frames_p=0x30caea90) at ../../../libgcc/unwind.inc:162
#3  0x30303858 in _Unwind_ForcedUnwind (exc=0x30caf658, stop=0x30321dcc <unwind_stop>, stop_argument=0x30caeea4) at ../../../libgcc/unwind.inc:217
#4  0x30321fc0 in __GI___pthread_unwind (buf=<optimized out>) at unwind.c:121
#5  0x30312388 in __do_cancel () at pthreadP.h:313
#6  sigcancel_handler (sig=32, si=0x30caec98, ctx=<optimized out>) at nptl-init.c:162
#7  sigcancel_handler (sig=<optimized out>, si=0x30caec98, ctx=<optimized out>) at nptl-init.c:127
#8  <signal handler called>
#9  0x303266d0 in __futex_abstimed_wait_cancelable64 (futex_word=0x7ffffd78,  expected=1, clockid=<optimized out>, abstime=0x0, private=<optimized out>) at ../sysdeps/nptl/futex-internal.c:66
#10 0x303210f8 in __new_sem_wait_slow64 (sem=0x7ffffd78, abstime=0x0, clockid=0) at sem_waitcommon.c:285
#11 0x00002884 in tf (arg=0x7ffffd78) at throw-pthread-sem.cc:35
Debugging when the unwinding stops can be done by setting a breakpoint
on the unwind_stop function.
When debugging I was able to see that the unwinder failed when looking for
the __futex_abstimed_wait_cancelable64 frame. So, this is not an issue
with unwinding signal frames.
A second Hypothosis
Debugging showed that the uwinder is working correctly, and it can properly
unwind through our signal frames. However, the unwinder is bailing out early
before it gets to the tf frame which has the catch block we need to execute.
Hypothesis 2: There is something wrong finding DWARF info for __futex_abstimed_wait_cancelable64.
Looking at libpthread.so with readelf this function was missing completely from the .eh_frame
metadata. Now we found something.
What creates the .eh_frame anyway? GCC or Binutils (Assembler). If we run GCC
with the -S argument we can see GCC will output inline .cfi directives.
These .cfi annotations are what gets compiled to the to .eh_frame. GCC
creates the .cfi directives and the Assembler puts them into the .eh_frame
section.
An example of gcc -S:
         .file   "unwind.c"
        .section        .text
        .align 4
        .type   unwind_stop, @function
unwind_stop:
.LFB83:
        .cfi_startproc
        l.addi  r1, r1, -28
        .cfi_def_cfa_offset 28
        l.sw    0(r1), r16
        l.sw    4(r1), r18
        l.sw    8(r1), r20
        l.sw    12(r1), r22
        l.sw    16(r1), r24
        l.sw    20(r1), r26
        l.sw    24(r1), r9
        .cfi_offset 16, -28
        .cfi_offset 18, -24
        .cfi_offset 20, -20
        .cfi_offset 22, -16
        .cfi_offset 24, -12
        .cfi_offset 26, -8
        .cfi_offset 9, -4
        l.or    r24, r8, r8
        l.or    r22, r10, r10
        l.lwz   r18, -1172(r10)
        l.lwz   r20, -692(r10)
        l.lwz   r17, -688(r10)
        l.add   r20, r20, r17
        l.andi  r16, r4, 16
        l.sfnei r16, 0
When looking at the glibc build I noticed the .eh_frame data for
__futex_abstimed_wait_cancelable64 is missing from futex-internal.o. The one
where unwinding is failing we find it was completely mising .cfi directives.
Why is GCC not generating .cfi directives for this file?
        .file   "futex-internal.c"
        .section        .text
        .section        .rodata.str1.1,"aMS",@progbits,1
.LC0:
        .string "The futex facility returned an unexpected error code.\n"
        .section        .text
        .align 4
        .global __futex_abstimed_wait_cancelable64
        .type   __futex_abstimed_wait_cancelable64, @function
__futex_abstimed_wait_cancelable64:
        l.addi  r1, r1, -20
        l.sw    0(r1), r16
        l.sw    4(r1), r18
        l.sw    8(r1), r20
        l.sw    12(r1), r22
        l.sw    16(r1), r9
        l.or    r22, r3, r3
        l.or    r20, r4, r4
        l.or    r16, r6, r6
        l.sfnei r6, 0
        l.ori   r17, r0, 1
        l.cmov  r17, r17, r0
        l.sfeqi r17, 0
        l.bnf   .L14
         l.nop
Looking closer at the build line of these 2 files I see the build of futex-internal.c
is missing -fexceptions.
This flag is needed to enable the eh_frame section, which is what powers C++
exceptions, the flag is needed when we are building C code which needs to
support C++ exceptions.
So why is it not enabled? Is this a problem with the GLIBC build?
Looking at GLIBC the nptl/Makefile set’s -fexceptions explicitly for each
c file that needs it. For example:
# The following are cancellation points.  Some of the functions can
# block and therefore temporarily enable asynchronous cancellation.
# Those must be compiled asynchronous unwind tables.
CFLAGS-pthread_testcancel.c += -fexceptions
CFLAGS-pthread_join.c += -fexceptions -fasynchronous-unwind-tables
CFLAGS-pthread_timedjoin.c += -fexceptions -fasynchronous-unwind-tables
CFLAGS-pthread_clockjoin.c += -fexceptions -fasynchronous-unwind-tables
CFLAGS-pthread_once.c += $(uses-callbacks) -fexceptions \
                        -fasynchronous-unwind-tables
CFLAGS-pthread_cond_wait.c += -fexceptions -fasynchronous-unwind-tables
CFLAGS-sem_wait.c += -fexceptions -fasynchronous-unwind-tables
CFLAGS-sem_timedwait.c += -fexceptions -fasynchronous-unwind-tables
CFLAGS-sem_clockwait.c = -fexceptions -fasynchronous-unwind-tables
It is missing such a line for futex-internal.c. The following patch and a
libpthread rebuild fixes the issue!
--- a/nptl/Makefile
+++ b/nptl/Makefile
@@ -220,6 +220,7 @@ CFLAGS-pthread_cond_wait.c += -fexceptions -fasynchronous-unwind-tables
 CFLAGS-sem_wait.c += -fexceptions -fasynchronous-unwind-tables
 CFLAGS-sem_timedwait.c += -fexceptions -fasynchronous-unwind-tables
 CFLAGS-sem_clockwait.c = -fexceptions -fasynchronous-unwind-tables
+CFLAGS-futex-internal.c += -fexceptions -fasynchronous-unwind-tables

 # These are the function wrappers we have to duplicate here.
 CFLAGS-fcntl.c += -fexceptions -fasynchronous-unwind-tables
I submitted this patch
to GLIBC but it turns out it was already fixed upstream
a few weeks before. Doh.
Summary
I hope the investigation into debugging this C++ exception test case proved interesting.
We can learn a lot about the deep internals of our tools when we have to fix bugs in them.
Like most illusive bugs, in the end this was a trivial fix but required some
key background knowledge.
Additional Reading