This is the story of figuring out why OpenRISC Linux was no longer booting on FPGA boards.
In July 2025 we received a bug report: #168 mor1kx pipeline is stuck in dualcore iverilog RTL simulation.
The report showed a hang on the second CPU of a custom multicore platform. The CPU cores that we use in FPGA based SoCs are highly configurable, we can change cache sizes, MMU set sizes, memory synchronization strategies and other settings. Our first step were to ensure that these settings were correct. After some initial discussions and adjustments the user was able to make progress, but Linux booted and hung with an error. The following is a snippet of the boot log:
[ 72.530000] Run /init as init process
[ 95.470000] rcu: INFO: rcu_sched detected stalls on CPUs/tasks:
[ 95.470000] rcu: (detected by 0, t=2102 jiffies, g=-1063, q=3 ncpus=2)
[ 95.470000] rcu: All QSes seen, last rcu_sched kthread activity 2088 (-20453--22541), jiffies_till_next_fqs=1, root ->qsmask 0x0
[ 95.470000] rcu: rcu_sched kthread timer wakeup didn't happen for 2087 jiffies! g-1063 f0x2 RCU_GP_WAIT_FQS(5) ->state=0x200
[ 95.470000] rcu: Possible timer handling issue on cpu=1 timer-softirq=194
[ 95.470000] rcu: rcu_sched kthread starved for 2088 jiffies! g-1063 f0x2 RCU_GP_WAIT_FQS(5) ->state=0x200 ->cpu=1
[ 95.470000] rcu: Unless rcu_sched kthread gets sufficient CPU time, OOM is now expected behavior.
[ 95.470000] rcu: RCU grace-period kthread stack dump:
[ 95.470000] task:rcu_sched state:R stack:0 pid:12 tgid:12 ppid:2 task_flags:0x208040 flags:0x00000000
[ 95.470000] Call trace:
[ 95.470000] [<(ptrval)>] 0xc00509a4
[ 95.470000] [<(ptrval)>] 0xc0050a04
In the above log we see an RCU stall warning indicating that CPU 1 running but not making progressing and is likely stuck in a tight loop. We can also see that the CPUs are both running but hanging. It took until December 2025, 5 months, to locate and fix the bug. In this article we will discuss how we debugged and solved this issue.
Reproducing the issue
The software that the user uses is the standard OpenRISC kernel and runtime. It has been stable for some time running on the QEMU simulator that we use for the bulk of our software development and testing.
To be honest I haven’t run the OpenRISC multicore platform on a physical FGPA development board for a few years, so just setting up the environment was going to be a significant undertaking.
For the past few years I have been concentrating on OpenRISC software so this meant using QEMU which is much more convenient.
To get the environment running we need a bunch of stuff:
- De0 Nano Cyclone IV FPGA dev board with assortment of USB and serial device cables
- fusesoc 2.4.3 - Tool for RTL package management, building and device programming.
- Quartus Prime Design Software 24.1 - for verilog synthesis and place and route
- The fusesoc OpenRISC multicore SoC - https://github.com/stffrdhrn/de0_nano-multicore
- OpenOCD 0.11.0 for debugging and loading software onto the board
- The OpenRISC toolchain 15.1.0
- Linux kernel source code
- Old kernel patches to get OpenRISC running on the de0 nano
- A busybox rootfs for userspace utilities
There is a lot of information about how to get your FPGA board working with openrisc in our De0 Nano tutorials. Please refer to the tutorials if you would like to follow up.
Some notes about what I had to figure out when getting the De0 Nano development environment up again:
- OpenOCD versions after 0.11 no longer work with OpenRISC and it’s adv_debug_sys debug interface. Never versions of OpenOCD will connect over the USB Blaster JTAG connection but requests to write and read fail with CDC failures.
- While debugging the OpenOCD issues I verified our simulated JTAG connectivity which uses OpenOCD to connect over jtag_vpi does still work.
- Fusesoc is continuously evolving and the de0_nano and
de0_nano-multicore. projects needed to be updated to get them working again.
Once the development board was loaded and running a simple hello world program as per the tutorial I could continue try to run Linux.
Building the Linux Kernel
To build and load the Linux kernel requires the kernel source, a kernel config and a devicetree (DTS) file for our De0 Nano multicore board. At the time of this writing we didn’t have one available in the upstream kernel source tree, so we need to create one. This means we need to patch and configure the Linux kernel for De0 Nano support.
Patching the Kernel
We can start with the existing OpenRISC multicore kernel config then make some
adjustments. To get started we can configure the kernel with simple_smp_defconfig
as follows.
make ARCH=openrisc CROSS_COMPILE=or1k-linux- simple_smp_defconfig
make
This gives us a good baseline. We then need to create a device tree that works for the De0 Nano, it is also almost the same as the simple SMP board but:
- The FPGA SoC runs at 50Mhz instead of 20Mhz
- The FPGA SoC has no ethernet
Starting with the existing simple_smp.dts I modified it creating
de0nano-smp.dts and placed it in
the arch/openrisc/boot/dts directory.
--- arch/openrisc/boot/dts/simple_smp.dts       2026-02-11 20:15:20.244628708 +0000
+++ arch/openrisc/boot/dts/de0nano-smp.dts      2026-02-12 17:24:15.959947375 +0000
@@ -25,12 +25,12 @@
                cpu@0 {
                        compatible = "opencores,or1200-rtlsvn481";
                        reg = <0>;
-                       clock-frequency = <20000000>;
+                       clock-frequency = <50000000>;
                };
                cpu@1 {
                        compatible = "opencores,or1200-rtlsvn481";
                        reg = <1>;
-                       clock-frequency = <20000000>;
+                       clock-frequency = <50000000>;
                };
        };

@@ -57,13 +57,6 @@
                compatible = "opencores,uart16550-rtlsvn105", "ns16550a";
                reg = <0x90000000 0x100>;
                interrupts = <2>;
-               clock-frequency = <20000000>;
-       };
-
-       enet0: ethoc@92000000 {
-               compatible = "opencores,ethoc";
-               reg = <0x92000000 0x800>;
-               interrupts = <4>;
-               big-endian;
+               clock-frequency = <50000000>;
        };
 };
Configuring the kernel
The default smp config does not have debugging configured. Run make ARCH=openrisc menuconfig
and enable the following.
 Kernel hacking  --->
   printk and dmesg options  --->
    [*] Show timing information on printks              CONFIG_PRINTK_TIME=y
   Compile-time checks and compiler options  --->
        Debug information (Disable debug information)   CONFIG_DEBUG_INFO_DWARF_TOOLCHAIN_DEFAULT=y
    [*] Provide GDB scripts for kernel debugging        CONFIG_GDB_SCRIPTS=y

 General setup  --->
   [*] Configure standard kernel features (expert users)  --->
     [*]   Load all symbols for debugging/ksymoops      CONFIG_KALLSYMS=y
The CONFIG_KALLSYMS seems unremarkable, but it is one of the most important config switches
to enable. This enables our stack traces to show symbol information, which makes it easier to understand
where our crashes happen.
With all of that configured we can build the kernel.
make -j12 \
  ARCH=openrisc \
  CROSS_COMPILE=or1k-linux- \
  CONFIG_INITRAMFS_SOURCE="$HOME/work/openrisc/busybox-rootfs/initramfs $HOME/work/openrisc/busybox-rootfs/initramfs.devnodes" \
  CONFIG_BUILTIN_DTB_NAME="de0nano-smp"
When the kernel build is complete we should see our vmlinux image as follows.
$ ls -ltr | tail -n5
-rwxr-xr-x.   1 shorne shorne  104863360 Jan 30 13:30 vmlinux.unstripped
-rw-r--r--.   1 shorne shorne     971587 Jan 30 13:30 System.map
-rwxr-xr-x.   1 shorne shorne      11975 Jan 30 13:30 modules.builtin.modinfo
-rw-r--r--.   1 shorne shorne       1047 Jan 30 13:30 modules.builtin
-rwxr-xr-x.   1 shorne shorne  104763212 Jan 30 13:30 vmlinux
The vmlinux image is an ELF
binary ready to load onto our
board. I have also uploaded a patch for adding the device tree file and a defconfig
to GitHub for easy reproduction.
Booting the Image
Loading the kernel onto our FPGA board using the GDB and OpenOCD commands from the tutorial the system boots.
The system runs for a while and maybe we can execute commands, 2 CPU’s are reported online but after some time we get the following lockup and the system stops.
[  410.790000] rcu: INFO: rcu_sched self-detected stall on CPU
[  410.790000] rcu:     0-...!: (2099 ticks this GP) idle=4f64/1/0x40000002 softirq=438/438 fqs=277
[  410.790000] rcu:     (t=2100 jiffies g=-387 q=1845 ncpus=2)
[  410.790000] rcu: rcu_sched kthread starved for 1544 jiffies! g-387 f0x0 RCU_GP_WAIT_FQS(5) ->state=0x0 ->cpu=1
[  410.790000] rcu:     Unless rcu_sched kthread gets sufficient CPU time, OOM is now expected behavior.
[  410.790000] rcu: RCU grace-period kthread stack dump:
[  410.790000] task:rcu_sched       state:R  running task     stack:0     pid:13    tgid:13    ppid:2      task_flags:0x208040 flags:0x00000000
...
[  411.000000] rcu: Stack dump where RCU GP kthread last ran:
[  411.000000] Task dump for CPU 1:
[  411.000000] task:kcompactd0      state:R  running task     stack:0     pid:29    tgid:29    ppid:2      task_flags:0x218040 flags:0x00000008
[  411.000000] Call trace:
[  411.050000] [<(ptrval)>] sched_show_task.part.0+0x104/0x138
[  411.050000] [<(ptrval)>] dump_cpu_task+0xd8/0xe0
[  411.050000] [<(ptrval)>] rcu_check_gp_kthread_starvation+0x1bc/0x1e4
[  411.050000] [<(ptrval)>] rcu_sched_clock_irq+0xd00/0xe9c
[  411.050000] [<(ptrval)>] ? ipi_icache_page_inv+0x0/0x24
[  411.050000] [<(ptrval)>] update_process_times+0xa8/0x128
[  411.050000] [<(ptrval)>] tick_nohz_handler+0xd8/0x264
[  411.050000] [<(ptrval)>] ? tick_program_event+0x78/0x100
[  411.100000] [<(ptrval)>] tick_nohz_lowres_handler+0x54/0x80
[  411.100000] [<(ptrval)>] timer_interrupt+0x88/0xc8
[  411.100000] [<(ptrval)>] _timer_handler+0x84/0x8c
[  411.100000] [<(ptrval)>] ? smp_call_function_many_cond+0x4d4/0x5b0
[  411.100000] [<(ptrval)>] ? ipi_icache_page_inv+0x0/0x24
[  411.100000] [<(ptrval)>] ? smp_call_function_many_cond+0x1bc/0x5b0
[  411.100000] [<(ptrval)>] ? __alloc_frozen_pages_noprof+0x118/0xde8
[  411.150000] [<(ptrval)>] ? ipi_icache_page_inv+0x14/0x24
[  411.150000] [<(ptrval)>] ? smp_call_function_many_cond+0x4d4/0x5b0
[  411.150000] [<(ptrval)>] on_each_cpu_cond_mask+0x28/0x38
[  411.150000] [<(ptrval)>] smp_icache_page_inv+0x30/0x40
[  411.150000] [<(ptrval)>] update_cache+0x12c/0x160
[  411.150000] [<(ptrval)>] handle_mm_fault+0xc48/0x1cc0
[  411.150000] [<(ptrval)>] ? _raw_spin_unlock_irqrestore+0x28/0x38
[  411.150000] [<(ptrval)>] do_page_fault+0x1d0/0x4b4
[  411.200000] [<(ptrval)>] ? sys_setpgid+0xe4/0x1f8
[  411.200000] [<(ptrval)>] ? _data_page_fault_handler+0x104/0x10c
[  411.200000] CPU: 0 UID: 0 PID: 61 Comm: sh Not tainted 6.19.0-rc5-simple-smp-00005-g4c0503f58a74 #339 NONE
[  411.200000] CPU #: 0
[  411.200000]    PC: c00e9dc4    SR: 0000807f    SP: c1235da4
[  411.200000] GPR00: 00000000 GPR01: c1235da4 GPR02: c1235e00 GPR03: 00000006
[  411.200000] GPR04: c1fe3ae0 GPR05: c1fe3ae0 GPR06: 00000000 GPR07: 00000000
[  411.200000] GPR08: 00000002 GPR09: c00ea0dc GPR10: c1234000 GPR11: 00000006
[  411.200000] GPR12: ffffffff GPR13: 00000002 GPR14: 300ef234 GPR15: c09b7b20
[  411.200000] GPR16: c1fc1b30 GPR17: 00000001 GPR18: c1fe3ae0 GPR19: c1fcffe0
[  411.200000] GPR20: 00000001 GPR21: ffffffff GPR22: 00000001 GPR23: 00000002
[  411.200000] GPR24: c0013950 GPR25: 00000000 GPR26: 00000001 GPR27: 00000000
[  411.200000] GPR28: 01616000 GPR29: 0000000b GPR30: 00000001 GPR31: 00000002
[  411.200000]   RES: 00000006 oGPR11: ffffffff
[  411.200000] Process sh (pid: 61, stackpage=c12457c0)
[  411.200000]
[  411.200000] Stack:
[  411.200000] Call trace:
[  411.200000] [<(ptrval)>] smp_call_function_many_cond+0x4d4/0x5b0
[  411.200000] [<(ptrval)>] on_each_cpu_cond_mask+0x28/0x38
[  411.200000] [<(ptrval)>] smp_icache_page_inv+0x30/0x40
[  411.200000] [<(ptrval)>] update_cache+0x12c/0x160
[  411.200000] [<(ptrval)>] handle_mm_fault+0xc48/0x1cc0
[  411.200000] [<(ptrval)>] ? _raw_spin_unlock_irqrestore+0x28/0x38
[  411.200000] [<(ptrval)>] do_page_fault+0x1d0/0x4b4
[  411.200000] [<(ptrval)>] ? sys_setpgid+0xe4/0x1f8
[  411.200000] [<(ptrval)>] ? _data_page_fault_handler+0x104/0x10c
[  411.200000]
[  411.200000]  c1235d84:       0000001c
[  411.200000]  c1235d88:       00000074
[  411.200000]  c1235d8c:       c1fc0008
[  411.200000]  c1235d90:       00000000
[  411.200000]  c1235d94:       c1235da4
[  411.200000]  c1235d98:       c0013964
[  411.200000]  c1235d9c:       c1235e00
[  411.200000]  c1235da0:       c00ea0dc
[  411.200000] (c1235da4:)      00000006
From the trace we can see both CPU’s are in similar code locations.
- CPU0 : is in
smp_icache_page_inv -> on_each_cpu_cond_mask -> smp_call_function_many_cond - CPU1 : is in
smp_icache_page_inv -> on_each_cpu_cond_mask
CPU1 is additionally handling a timer which is reporting the RCU stall, we can ignore those bits of the stack, as it is reporting the problem for us it is not the root cause. So what is happening?
Let’s try to understand what is happening. The smp_icache_page_inv function
is called to invalidate an icache page, it will force all CPU’s to invalidate a
cache entry by scheduling each CPU to call a cache invalidation function. This
is scheduled with the smp_call_function_many_cond call.
On CPU0 and CPU1 this is being initiated by a page fault as we see
do_page_fault at the bottom of the stack. The do_page_fault function will be
called when the CPU handles a TLB miss exception or if there was a page fault.
This must mean that a executable page was not available in memory and access to
that page caused a fault, once the page was mapped the icache needs to be
invalidated, this is done via the kernel’s inter-processor interrupt
(IPI) mechanism.
The IPI allows one CPU to request work to be done on other CPUs, this is done
using the on_each_cpu_cond_mask function call.
If we open up the debugger we can see, we are stuck in csd_lock_wait here:
$ or1k-elf-gdb "$HOME/work/linux/vmlinux" -ex 'target remote :3333'
GNU gdb (GDB) 17.0.50.20250614-git
This GDB was configured as "--host=x86_64-pc-linux-gnu --target=or1k-elf".

#0  0xc00ea11c in csd_lock_wait (csd=0xc1fd0000) at kernel/smp.c:351
351             smp_cond_load_acquire(&csd->node.u_flags, !(VAL & CSD_FLAG_LOCK));
Checking the backtrace we see csd_lock_wait is indeed inside the IPI framework
function smp_call_function_many_cond:
(gdb) bt
#0  0xc00ea11c in csd_lock_wait (csd=0xc1fd0000) at kernel/smp.c:351
#1  smp_call_function_many_cond (mask=<optimized out>, func=0xc0013ca8 <ipi_icache_page_inv>, info=0xc1ff8920, scf_flags=<optimized out>,
    cond_func=<optimized out>) at kernel/smp.c:877
#2  0x0000002e in ?? ()
Here csd stands for Call Single Data which is part IPI framework’s remote
function call api. The csd_lock_wait function calls smp_cond_load_acquire
which we can see below:
kernel/smp.c
    static __always_inline void csd_lock_wait(call_single_data_t *csd)
    {
        smp_cond_load_acquire(&csd->node.u_flags, !(VAL & CSD_FLAG_LOCK));
    }
The CSD_FLAG_LOCK flag is defined as seen here:
include/linux/smp_types.h
enum {
        CSD_FLAG_LOCK           = 0x01,
        ...
The smp_cond_load_acquire macro is just a loop waiting for &csd->node.u_flags
the 1 bit CSD_FLAG_LOCK to be cleared.
If we check the value of the u_flags:
(gdb) p/x csd->node.u_flags
$14 = 0x86330004
What is this we see? The value is 0x86330004, but that means the 0x1 bit is not set.
It should be exiting the loop. As the RCU stall warning predicted our CPU is
stuck in tight loop. In this case the loop is in csd_lock_wait.
The value in memory does not match the value the CPU is reading. Is this a memory synchronization issue? Does the CPU cache incorrectly have the locked flag?
It’s a Hardware Issue
As this software works fine in QEMU, I was first suspecting this was a hardware issue. Perhaps there is an issue with cache coherency.
Luckily on OpenRISC we can disable caches. I built the CPU with the caches
disabled, this is done by changing the following module parameters from
ENABLED to NONE as below, then re-synthesizing.
$ grep -r FEATURE.*CACHE ../de0_nano-multicore/
../de0_nano-multicore/rtl/verilog/orpsoc_top.v: .FEATURE_INSTRUCTIONCACHE       ("ENABLED"),
../de0_nano-multicore/rtl/verilog/orpsoc_top.v: .FEATURE_DATACACHE              ("ENABLED"),
../de0_nano-multicore/rtl/verilog/orpsoc_top.v: .FEATURE_INSTRUCTIONCACHE       ("ENABLED"),
../de0_nano-multicore/rtl/verilog/orpsoc_top.v: .FEATURE_DATACACHE              ("ENABLED"),
After this the system booted very slow, but we still had hang’s, I was stumped.
Gemini to the Rescue
I thought I would try out Gemini AI to help debug the issue. I was able to paste in the kernel crash dumps and AI was able to come to the same conclusion I did. It thought that it may be a memory synchonization issue.
But Gemini was not able to help, it kept chasing red herrings.
- At first it suggsted looking at the memory barriers in the
csd_lock_waitcode. I uploaded some of the OpenRISC kernel source code. It was certain it found the issue, I was not convinced but humored it. It suggested kernel patches I applied them and confirmed they didn’t help. - I asked if it could be a hardware bug, Gemini thought this was a great idea. If there was an issue with the CPU’s Load Store Unit (LSU) not flushing or losing writes it could be the cause of the lock not being released. I uploaded some of the OpenRISC CPU verilog source code. It was certain it found the bug in the LSU, again I was not concinced looking at it’s patches. The patches did not improve anything.
We went through several iterations of this, none of the suggestions were correct. I humored the patches but they did not work.
Gemini does help with discussing the issues, highlighting details, and process of elimination, but it’s not able think much beyond the evidence I provide. They seem lack the ability to think beyond it’s current context.
We will need to figure this out on our own.
Using a Hardware Debugger
I had some doubt that the values I was seeing in the GDB debug session were correct. As a last ditch effort I brought up SignalTap, an FPGA virtual logic analyzer. In other words this is a hardware debugger.
What should we look for in SignalTap? We want to confirm what is really in memory when the CPU is reading the flags variable from memory in the lock loop.
From our GDB session above we recall the csd_lock_wait lock loop was around PC address 0xc00ea11c.
If we dump this area of the Linux binary we see the following:
$ or1k-elf-objdump -d vmlinux | grep -C5 c00ea11c
c00ea108:       0c 00 00 07     l.bnf c00ea124 <smp_call_function_many_cond+0x1c4>
c00ea10c:       15 00 00 00     l.nop 0x0
c00ea110:       86 33 00 04     l.lwz r17,4(r19)  <---------------------------------+
c00ea114:       a6 31 00 01     l.andi r17,r17,0x1                                  |
c00ea118:       bc 11 00 00     l.sfeqi r17,0                                       |
c00ea11c:<--    0f ff ff fd     l.bnf c00ea110 <smp_call_function_many_cond+0x1b0> -+
c00ea120:       15 00 00 00      l.nop 0x0
c00ea124:       22 00 00 00     l.msync
c00ea128:       bc 17 00 02     l.sfeqi r23,2
c00ea12c:       0f ff ff e1     l.bnf c00ea0b0 <smp_call_function_many_cond+0x150>
c00ea130:       aa 20 00 01     l.ori r17,r0,0x1
We can see the l.lwz instruction is used to read in the flags value from
memory. The l.lwz instruction instructs the CPU to load data at an address in
memory to a CPU register. The CPU module that handles memory access is called
the Load Store Unit (LSU). Let’s setup the logic analyzer to capture the LSU
signals.
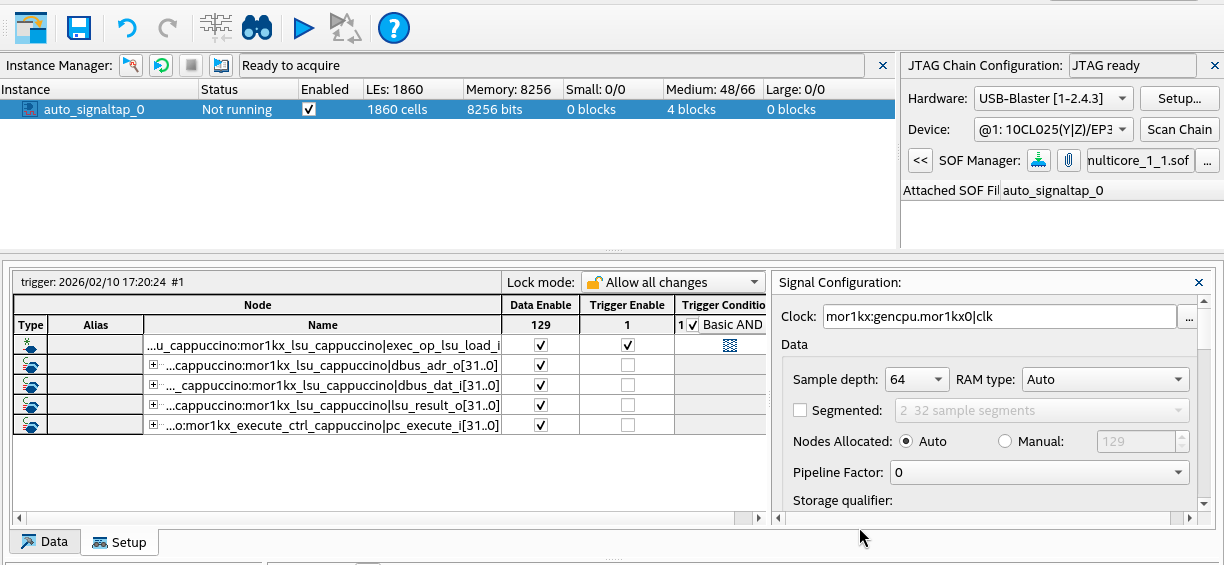
In CPU core 0’s module mor1kx_lsu_cappuccino select signals:
pc_execute_i- The PC for the execute stage, this lets us know which instruction is waiting to executeexec_op_lsu_load_i- Signal that is asserted when the LSU is being asked to perform a loaddbus_adr_o- The address being communicated from the LSU to the memory bus for the data loaddbus_dat_i- The data being communicated from the memory bus back to the LSUlsu_result_o- The data captured by the LSU to be written to the register file
Note 1 During this build, we disable the data cache to make sure loads are not cached. Otherwise our load would go out to the memory bus one time and be hard to capture in the logic analyzer.
Note 2 We select only signals on CPU 0, as the csd_lock_wait lock loop is occurring on both CPUs.
Note 3 I found that if I added too many signals to SignalTap that Linux would fail to boot as the CPU would get stuck with BUS errors. So be aware.
In SignalTap our setup looks like the following:
After the setup we can try to boot the kernel and observe the lockup. When the lockup occurs if we capture data we see the below:
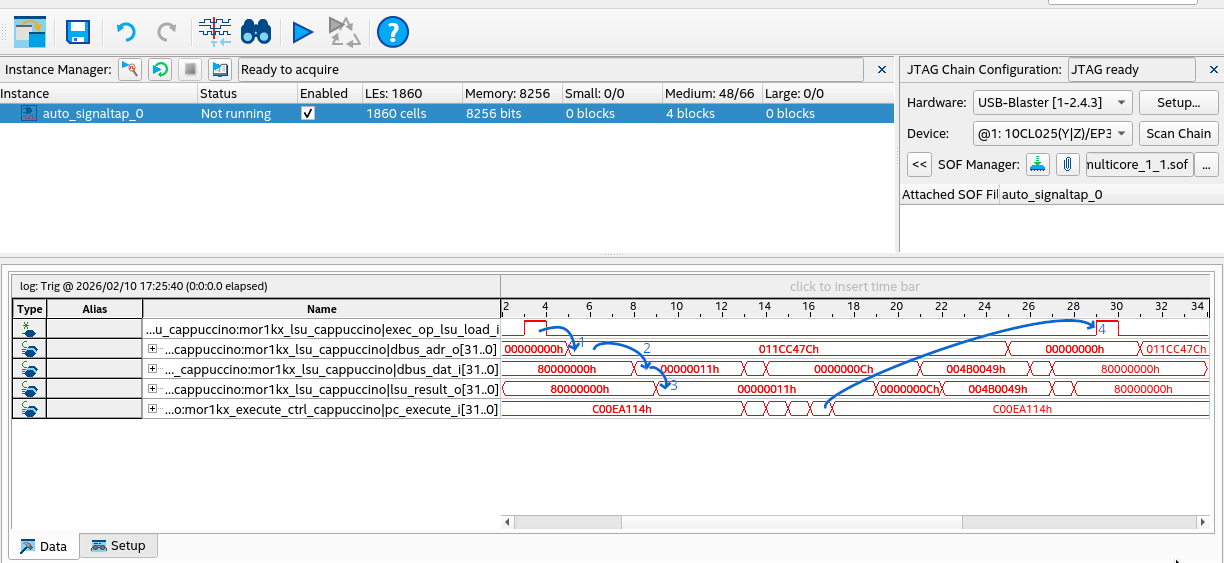
I have annotated the transitions in the trace:
- Moments after the
exec_op_lsu_load_isignal is asserted, thedbus_adr_ois set to0x011cc47c. This is the memory address to be read. - Next we see
0x11ondbus_dat_i. This is the value read from memory. - After this the value
0x11is outputted onlsu_result_oconfirming this is the value read. - Finally after a few instructions the loop continues again and
exec_op_lsu_load_iis asserted.
Here we have confirmed the CPU is properly reading 0x11, the lock is still held. What does this mean
does it mean that CPU 1 (the secondary CPU) did not handle the IPI and release the lock?
It does mean that our GDB analysis is wrong. There is no memory synchonization issue and the hardware is behaving as expect. We need another idea.
Actually, it’s a Kernel Issue
Since we know that is seems some IPIs are not getting handled properly it would be good to be able to know how many IPIs are getting sent and lost.
I added a patch to capture and dump IPI stats when OpenRISC crashes. What we see below is that CPU 1 is receiving no IPIs while CPU 0 has received all IPIs sent by CPU 1.
[  648.180000] CPU: 0 UID: 0 PID: 1 Comm: init Tainted: G             L      6.19.0-rc4-de0nano-smp-00002-ga7fc4d
[  648.180000] Tainted: [L]=SOFTLOCKUP
[  648.180000] CPU #: 0
[  648.180000]    PC: c00ea100    SR: 0000807f    SP: c1031cf8
[  648.180000] GPR00: 00000000 GPR01: c1031cf8 GPR02: c1031d54 GPR03: 00000006
[  648.180000] GPR04: c1fe4ae0 GPR05: c1fe4ae0 GPR06: 00000000 GPR07: 00000000
[  648.180000] GPR08: 00000002 GPR09: c00ea420 GPR10: c1030000 GPR11: 00000006
[  648.180000] GPR12: 00000029 GPR13: 00000002 GPR14: c1fe4ae0 GPR15: 0000000b
[  648.180000] GPR16: c1fc1b60 GPR17: 00000011 GPR18: c1fe4ae0 GPR19: c1fd0010
[  648.180000] GPR20: 00000001 GPR21: ffffffff GPR22: 00000001 GPR23: 00000002
[  648.180000] GPR24: c0013c98 GPR25: 00000000 GPR26: 00000001 GPR27: c09cd7b0
[  648.180000] GPR28: 01608000 GPR29: c09c4524 GPR30: 00000006 GPR31: 00000000
[  648.180000]   RES: 00000006 oGPR11: ffffffff
...
[  648.180000] IPI stats:
[  648.180000] Wakeup IPIs                sent:        1 recv:        0
[  648.180000] Rescheduling IPIs          sent:        8 recv:        0
[  648.180000] Function call IPIs         sent:        0 recv:        0
[  648.180000] Function single call IPIs  sent:       41 recv:       46
...
[  660.260000] CPU: 1 UID: 0 PID: 29 Comm: kcompactd0 Tainted: G             L      6.19.0-rc4-de0nano-smp-00002-
[  660.260000] Tainted: [L]=SOFTLOCKUP
[  660.260000] CPU #: 1
[  660.260000]    PC: c053ca40    SR: 0000827f    SP: c1095b58
[  660.260000] GPR00: 00000000 GPR01: c1095b58 GPR02: c1095b60 GPR03: c11f003c
[  660.260000] GPR04: c11f20c0 GPR05: 3002e000 GPR06: c1095b64 GPR07: c1095b60
[  660.260000] GPR08: 00000000 GPR09: c0145c00 GPR10: c1094000 GPR11: c11fc05c
[  660.260000] GPR12: 00000000 GPR13: 0002003d GPR14: c1095d2c GPR15: 00000000
[  660.260000] GPR16: c1095b98 GPR17: 0000001d GPR18: c11f0000 GPR19: 0000001e
[  660.260000] GPR20: 30030000 GPR21: 001f001d GPR22: c1fe401c GPR23: c09cd7b0
[  660.260000] GPR24: ff000000 GPR25: 00000001 GPR26: 01000000 GPR27: c1ff21a4
[  660.260000] GPR28: 00000000 GPR29: c1095dd8 GPR30: 3002e000 GPR31: 00000002
[  660.260000]   RES: c11fc05c oGPR11: ffffffff
...
[  660.300000] IPI stats:
[  660.300000] Wakeup IPIs                sent:        0 recv:        0
[  660.310000] Rescheduling IPIs          sent:        0 recv:        0
[  660.310000] Function call IPIs         sent:        0 recv:        0
[  660.310000] Function single call IPIs  sent:       46 recv:        0
Why is this? With some extra debugging I found that the programmable interrupt
controller mask register (PICMR) was 0x0 on CPU 1. This means that all interrupts
on CPU 1 are masked and CPU 1 will never receive any interrupts.
After a quick patch to unmask IPIs on secondary CPUs the system stability was fixed. This is the simple patch:
diff --git a/arch/openrisc/kernel/smp.c b/arch/openrisc/kernel/smp.c
index 86da4bc5ee0b..db3f6ff0b54a 100644
--- a/arch/openrisc/kernel/smp.c
+++ b/arch/openrisc/kernel/smp.c
@@ -138,6 +138,9 @@ asmlinkage __init void secondary_start_kernel(void)
        synchronise_count_slave(cpu);
        set_cpu_online(cpu, true);

+       // Enable IPIs, hack
+       mtspr(SPR_PICMR, mfspr(SPR_PICMR) | 0x2);
+
        local_irq_enable();
        /*
         * OK, it's off to the idle thread for us
Fixing the Bug Upstream
Simply unmasking the interrupts in Linux as I did above in the hack would not be accepted upstream. There are irqchip APIs that handle interrupt unmasking.
The OpenRISC IPI patch for the Linux 6.20/7.0 release updates the IPI interrupt driver to register a percpu_irq which allows us to unmask the irq handler on each CPU.
In the patch series I also added De0 Nano single core and multicore board configurations to allow for easier board bring up.
What went wrong with GDB?
Why did GDB return the incorrect values when we were debugging initially?
GDB is not broken, but it could be improved when debugging kernel code. Let’s look again at the GDB session and look at the addresses of our variables.
(gdb) l
346     {
347     }
348
349     static __always_inline void csd_lock_wait(call_single_data_t *csd)
350     {
351             smp_cond_load_acquire(&csd->node.u_flags, !(VAL & CSD_FLAG_LOCK));
352     }
353     #endif

(gdb) p/x csd->node.u_flags
$14 = 0x86330004

(gdb) p/x &csd->node.u_flags
$15 = 0xc1fd0004
Here we see the value GDB reads is 0x86330004, but the address of the variable is
0xc1fd0004. This is a kernel address as we see the 0xc0000000 address offset.
Let’s inspect the assembly code that is running.
(gdb) p/x $npc
$11 = 0xc00ea11c

(gdb) x/12i $npc-0xc000000c
   0xea110:     l.lwz r17,4(r19)
   0xea114:     l.andi r17,r17,0x1
   0xea118:     l.sfeqi r17,0
-->0xea11c:     l.bnf 0xea110
   0xea120:     l.nop 0x0
   0xea124:     l.msync
   0xea128:     l.sfeqi r23,2
   0xea12c:     l.bnf 0xea0b0
   0xea130:     l.ori r17,r0,0x1
   0xea134:     l.lwz r16,56(r1)
   0xea138:     l.lwz r18,60(r1)
   0xea13c:     l.lwz r20,64(r1)
Here we see the familiar loop, the register r19 stores the address of
csd->node and u_flags is at a 4 byte offset, hence l.lwz r17,4(r19).
The register r17 stores the value read from memory, then masked with 0x1.
We can see this below.
(gdb) p/x $r17
$4 = 0x1
(gdb) p/x $r19
$5 = 0xc1fd0000

(gdb) x/12x $r19
0xc1fd0000:     0x862a0008      0x862a0008      0x862a0008      0x862a0008
0xc1fd0010:     0x862a0008      0x862a0008      0x862a0008      0x862a0008
0xc1fd0020:     0x862a0008      0x862a0008      0x862a0008      0x862a0008
Here we see r19 is 0xc1fd0000 and if we inspect the memory at this location
we see values like 0x862a0008, which is strange.
Above we discussed these are kernel addresses, offset by 0xc0000000.
When the kernel does memory reads these will be mapped by the MMU to a physical address, in this case
0x01fd0004.
We can apply the offset ourselves and inspect memory as follows.
(gdb) x/12x $r19-0xc0000000
0x1fd0000:      0x00000000      0x00000011      0xc0013ca8      0xc1ff8920
0x1fd0010:      0x0000fe00      0x00000000      0x00000400      0x00000000
0x1fd0020:      0x01fd01fd      0x00000005      0x0000002e      0x0000002e
Bingo, this shows that we have 0x11 at 0x1fd0004 the lock value. Memory does
indeed contain 0x11 the same as the value read by the CPU.
When GDB does memory reads the debug interface issues reads directly to the memory bus. The CPU and MMU are not involved. This means, at the moment, we need to be careful when inspecting memory and be sure to perform the offsets ourselves.
Conclusion
Debugging accross the hardware-software boundary requires a bit of experience and a whole lot of parience. We initially thought that this was a harware issue, but then eventually found a trivial issue in the OpenRISC multicore support drivers. It took time and a few different tools to convince ourselves that the hardware was fine. After refocusing on the kernel and building some tools (the IPI stats report) we found the clue we needed.
This highlights the importance in embedded systems to know your tools and architecturte. Or, in our case, remember that the MMU does not translate memory reads over the JTAG interface. With the bug fixed and De0 Nano support merged upstream Linux on the OpenRISC platform not now more accessible and stable than before.
Followups
Working on this issue highlighted that there are a few things to improve in OpenRISC including:
- Tutorials and Upstreaming patches
- OpenOCD is currently broken for OpenRISC
- OpenOCD doesn’t support multicore (multicore patches never upstreamed)
- OpenOCD / GDB bugs