Did you ever get stuck figuring out how to run spice? These essential spice tips will get you on your way.
Recently I have been searching for good linux tools to simulate circuits. Spice is widely known in circuit simulation. This short guide should help you get started; including how to perform graphical plotting with nutmeg. All the below demos are using ngspice and ngnutmeg. In this post I assume you know the basics of writing or generating spice netlists.
We will cover the basics of:
- Analysis with
OPandTRAN - Controlling spice output
- Running
ngspiceandngnutmeg
Analysis
When analyzing a circuit we need to use spice analysis commands. These are usually placed at the end of your netlist.
Using OP
The first and most simple analysis command you should know is the OP command. It provides the dc operating point voltage dump of all nodes with capacitors fully charged (no current) and inductors fully inducting (shorted).
Usage
.op
Example
Download op.cir
* OP analysis of Voltage divider
V1 2 0 DC 10V
R1  2 1 50K
R2  1 0 20K
.op
.end
When running we can see that the voltage and current of each node is displayed.
$ ngspice -b op.cir

No. of Data Rows : 1
        Node                                  Voltage
        ----                                  -------
        ----    -------
        V(1)                             2.857143e+00
        V(2)                             1.000000e+01

        Source  Current
        ------  -------

        v1#branch                        -1.42857e-04
Using TRAN
The next analysis command to know is the TRAN command.
TRAN will run the circuit for a fixed time and take interval measurements. The below .tran 0.1m 5m will measure for 5 milliseconds and output every 0.1 milliseconds. It should print 50 readings. You should choose your measurements based on the frequency of the input source to allow you to see the full wave,
Usage
.tran STEP END <START> <MAX>
- STEP - is the time interval of how often a measurement is taken
- END - is the time when spice will end measurement
- START - (default 0) is the time when spice will start measurement
- MAX - is used to define a STEP smaller than STEP (yeah confusing)
Note: spice manuals mention the step time of TRAN is not always used by spice. If END-START/50 is less than STEP spice will set step to the smaller value. I haven’t seen this affect my simulations yet.
Example
Download tran.cir
* TRAN analysis of RC circuit
Vin  2 0 AC SIN(0 0.02 440)
R5  2 1 1K
C1  1 0 4.7uF
.tran 0.1m 3m
.plot tran v(2), v(1)
.end
When running we can see a plot printed of our analysis.
$ ngspice -b tran.cir

No. of Data Rows : 63
--------------------------------------------------------------------------
                       * ac analysis of rc circuit
               Transient Analysis Tue Apr 21 22:55:08  2015

Legend:  + = v(2)             * = v(1)
--------------------------------------------------------------------------
 time       v(2)    -2.00e-02   -1.00e-02    0.00e+00    1.00e-02    2.00e-02
----------------------|-----------|-----------|-----------|-----------|
 0.000e+00  0.000e+00 .           .           X           .           .
 1.000e-04  5.456e-03 .           .           *     +     .           .
 2.000e-04  1.047e-02 .           .           *           +           .
 3.000e-04  1.471e-02 .           .           *           .    +      .
 4.000e-04  1.786e-02 .           .           *           .        +  .
 5.000e-04  1.958e-02 .           .           .*          .          +.
 6.000e-04  1.987e-02 .           .           .*          .          +.
 7.000e-04  1.867e-02 .           .           . *         .         + .
 8.000e-04  1.598e-02 .           .           . *         .      +    .
 9.000e-04  1.213e-02 .           .           .  *        . +         .
 1.000e-03  7.356e-03 .           .           .  *    +   .           .
 1.100e-03  2.000e-03 .           .           . +*        .           .
 1.200e-03 -3.490e-03 .           .      +    .  *        .           .
 1.300e-03 -8.736e-03 .           .+          . *         .           .
 1.400e-03 -1.328e-02 .       +   .           . *         .           .
 1.500e-03 -1.684e-02 .  +        .           . *         .           .
 1.600e-03 -1.916e-02 .+          .           .*          .           .
 1.700e-03 -1.993e-02 +           .           .*          .           .
 1.800e-03 -1.926e-02 +           .           *           .           .
 1.900e-03 -1.714e-02 .  +        .           *           .           .
 2.000e-03 -1.365e-02 .      +    .          *.           .           .
 2.100e-03 -9.168e-03 .           +          *.           .           .
 2.200e-03 -3.990e-03 .           .      +   *.           .           .
 2.300e-03  1.502e-03 .           .          *.+          .           .
 2.400e-03  6.873e-03 .           .          *.       +   .           .
 2.500e-03  1.175e-02 .           .          *.           . +         .
 2.600e-03  1.567e-02 .           .           *           .     +     .
 2.700e-03  1.845e-02 .           .           *           .         + .
 2.800e-03  1.986e-02 .           .           *           .          +.
 2.900e-03  1.967e-02 .           .           .*          .          +.
 3.000e-03  1.810e-02 .           .           .*          .        +  .
----------------------|-----------|-----------|-----------|-----------|
 time       v(2)    -2.00e-02   -1.00e-02    0.00e+00    1.00e-02    2.00e-02

elapsed time since last call: 0.018 seconds.
Controlling Output
To output data during simulation we use the PLOT and PRINT commands. These commands work together with dynamic analysis commands like TRAN to output analysis data points.
The plot command will plot a ascii chart of analysis.
.plot tran v(1), v(8)
The print command will print the value of the analysis.
.print tran v(1), v(8)
Running Spice
When simulating a circuit we have a few options.
# Running in batch mode
$ ngspice -b op.cir
# Running in interactive move
$ ngspice
> source op.cir
> run
# will display output as above
> edit
# Will allow editing of your circuit
Another option is to output the analysis data in raw format. This data can then be loaded up in ngnutmeg for further analysis.
# This commands runs the analysis in preamp.cir and outputs raw data to
# tran.raw
ngspice -b tran.cir -r tran.raw
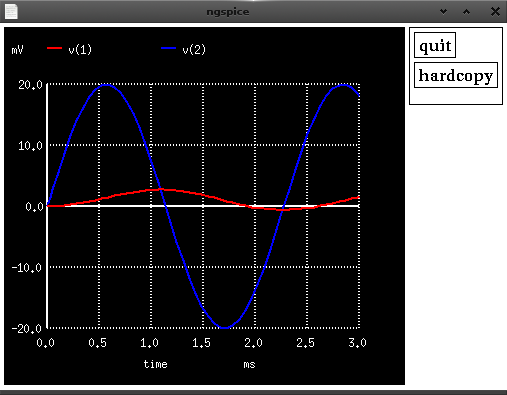
# The below command loads the raw file into ngnutmeg and then displays the
# ngnutmeg prompt. The `plot v(1)` command will bring up a view of the wave form
ngnutmeg tran.raw
> plot v(2) v(1)
Further Reading
Keep an eye on this stack exchange discussion which mentions other tools for simulating circuits in linux.
These guides have been very help:
- bwrcs.eecs.berkeley.edu - great reference, this links directly into analysis
- www.allaboutcircuits.com - simple intro to netlists
- vision.lakeheadu.ca op_ac_analysis.html - tutorial on running ngspice
opanalysis - vision.lakeheadu.ca transient_analysis.html - tutorial on running ngspice
trananalysis - www.seas.upenn.edu - good example of ac analysis
- dev.man-online.org - ngnutmeg manual